Over the past few months, we’ve seen an uptick in buyers who want to make an offer on a new home while their current property is still on the market. It makes sense, inventory is higher than recent years, and there are some great opportunities out there.
But… there’s a challenge:
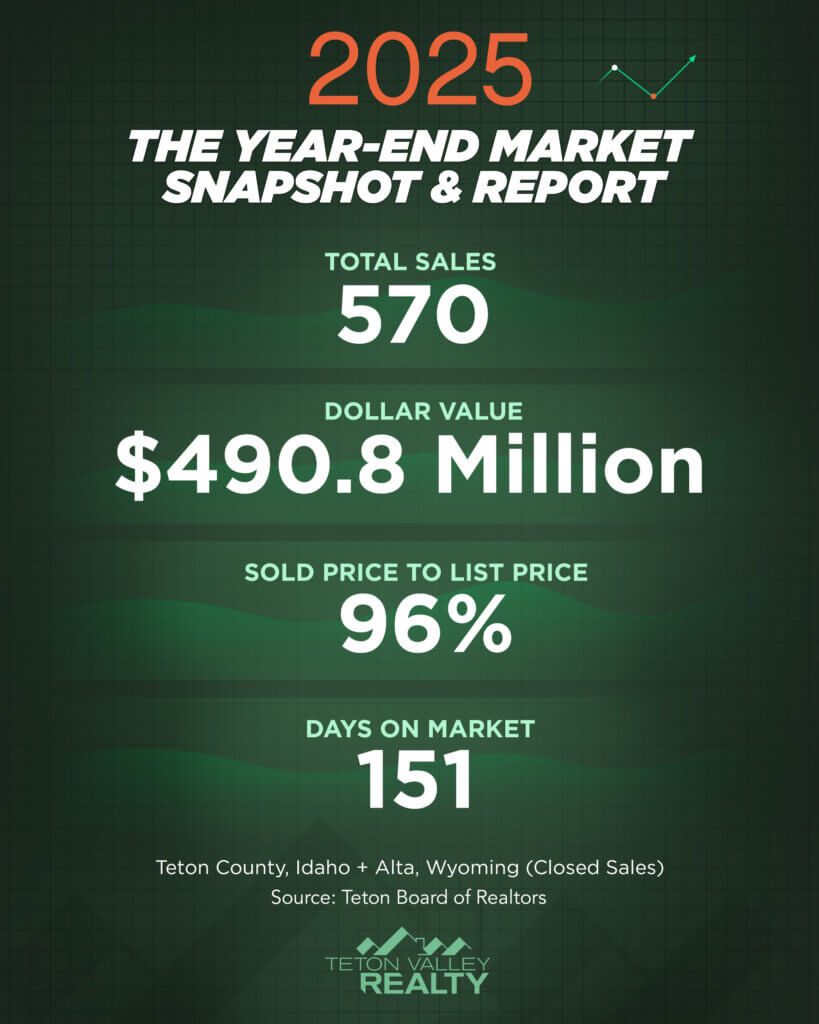
Days on market are longer than they were during the peak, and sellers are more cautious about accepting long contingencies. They don’t want their homes tied up for six months (which is close the average right now) while a buyer tries to sell another property.
The good news is that buyers have several options for making a smooth move without overextending themselves too much:
Traditional Contingency
A contingency lets you write an offer on a new home that’s dependent on selling your current one. It’s the simplest route, but most sellers will only agree to a short window, often 60–90 days is typically a comfortable zone. After that, they risk missing other buyers if your sale takes too long. With the average days on market around 5-6 months (at the time of this article) that usually means making a concession to sell your existing home faster.
Asset-Based Bridge Loan
For buyers who need more breathing room, an asset-based bridge loan can be a smart solution. It uses the equity in your existing property to provide the down payment on your next home. Payments are usually interest-only, and instead of paying every month, the interest is typically settled in one payment when your old home closes.
This approach allows you to:
- Lock in the new home without rushing to “fire-sell” your current one
- Price and market your property properly
- Offer sellers the certainty of a non-contingent contract
(Always confirm the exact terms with a qualified lender, we can connect you with experts who handle this every day.)
Hybrid Strategy
Sometimes, the best plan is a blend of both; put your current home on the market, see if it sells quickly, and line up a bridge loan as a backup if offers don’t come in right away. It creates flexibility while keeping the purchase moving forward.
Keep Your Current Home as an Investment
With many homeowners enjoying historically low, locked interest rates, some decide not to sell at all. If the numbers work, you might keep your existing home as a rental and finance the new one separately. This can be a great way to build wealth long-term, just make sure you qualify for both mortgages and that the rental income supports the plan. Often the rent income on your existing home can be factored into your overall income. The team over at Teton Valley Property Management can always provide rental advise.
The Bottom Line
Buying a new home while you still own another isn’t one-size-fits-all. The right path depends on your timing, financial goals, and the type of property you’re after. Whether you choose a short contingency, explore a bridge loan, take a hybrid approach, or keep your current home as an investment, understanding your options up front helps you make a confident move in today’s market.