Let’s talk about the Teton County, Idaho (unincorporated areas of the county) National Resource Overlay, and specifically, drill down on the required Wildlife Analyses.
Before we do, I’ll point out that the Natural Resource Overlay has been amended multiple times, most recently in 2025. This is a highly controversial topic, probably more so than any other issue with Teton County’s 2022 Land Development code second only to zoning changes themselves in my opinion. That being said, feel free to use this article to understand these overlays and policies as I do, but at the same token, take this as a grain of salt. I have made clear assumptions with respect to these policies based on the available data to find out that I was not aligned with the County Planning department. Always verify information with local authorities.
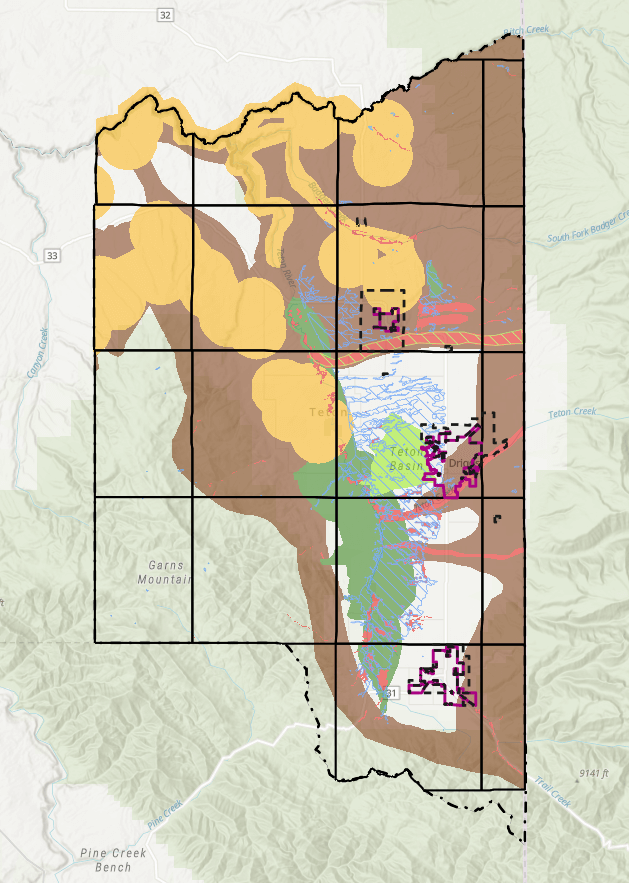
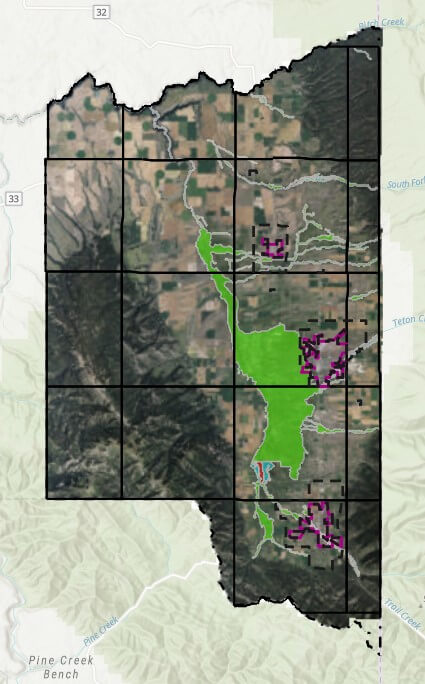
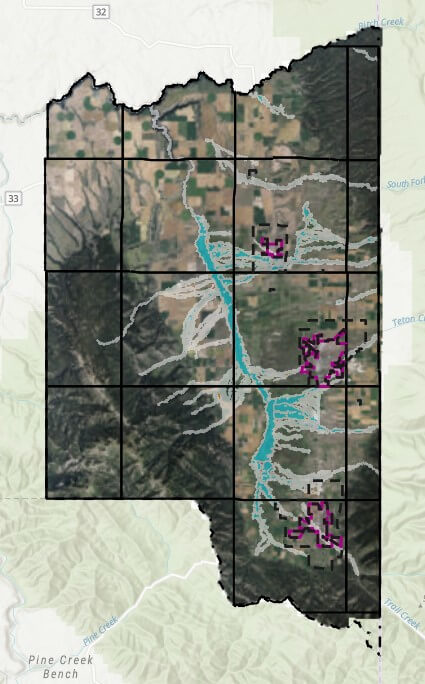
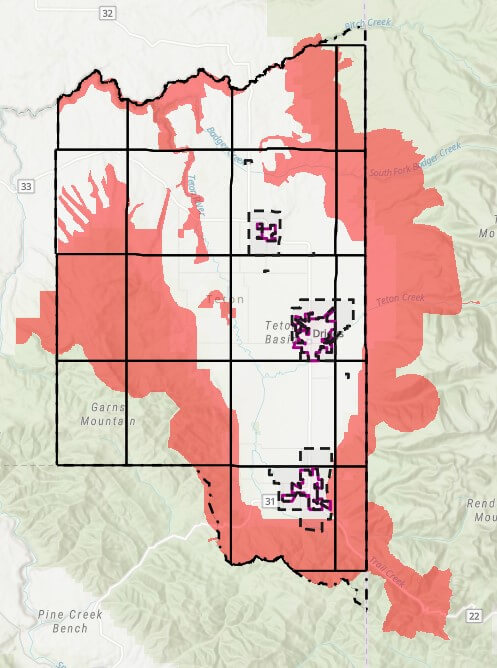
So, briefly, what is the Natural Resource Overlay? This is a mapped overlay adopted by Teton County to identify areas that are sensitive to wildlife and habitat. As I understand it, this data was gathered in conjunction with the Idaho Department of Fish and Game in 2022 as well as local experts and authorities. There are several overlays throughout the county identified below, I also created a map legend to help identify each.


A quick note on Wetland areas:
I won’t go into too much detail relative to Wetland habitat areas including the main overlay, the South Leigh forested areas or the Wood Creek Fen areas. These areas not only trigger Wildlife considerations, but also Wetland specific review. My understanding is that the South Lee forested wetlands in the Woodcreek Bend are locally defined priority Wetlands not always visible in the federal data sets like the NWI, but they are treated similarly and may still require Wetland delineations or other studies. I have other articles where I dive into Wetland, so for now, we’ll focus on the remaining Wildlife overlays.
What is a WHA vs an A-AWA?
Wildlife Habitat Analysis (WHA)
I would consider a WHA as intended to be a more specific, detailed analysis of a given property for specific reasons, primarily Subdivision / Land division and Special Use Permit or Conditional Use Permit situations. These are extensive studies to look at the viability of a subdivision of land that meets all other requirements and eligibility for subdivision in the county. They might look at placement of building envelopes or parcel sizes as they pertain to proximity to sensitive areas or how they might impact sensitive areas. Similarly, special or conditional permits may require these more calculated, advanced studies. They typically include detailed field work, mapping, species analysis and an overall conservation plan. They must be prepared by a pre-qualified consultant according to the County’s data set (applicants that are not pre-qualified can apply) and are reviewed by planning staff before moving to concept plan stages. They take into account cumulative landscape impacts, Wildlife corridors, and conservation ratios.
Abbreviated Wildlife Habitat Analysis (A-WHA)
Abbreviated analyzes are required for building permits within the nro, are short form by comparison, and are approved by the Planning and Building Department before building permit approval. They focus on site level planning and proximity to known habitat or sensitive features and are intended to be streamlined for homeowners and small-scale projects, however, they are still currently required to be performed by Consultants that are approved by the county. Here again, applicants that are not pre-qualified, can apply.
What Triggers the Requirement for an Analysis?
Essentially, any parcel with identified indicator habitat species, mapped Wetland or riparian zones, and most easily identified, Parcels that are located inside one of the Natural Resource Overlays. HOWEVER, there are situations when properties can be exempt from these requirements:
The parcel containing the proposed project is exempt from the need for a
WHA or A-WHA if one or more of the following conditions applies:
– The parcel is located completely outside the boundaries of the NRO.
– The parcel is partially within the NRO but the proposed project site on
the parcel is at least 100 feet outside of the boundaries of the NRO
(this condition applies for building permit requests only).
– The parcel has previously undergone a county-approved natural
resource analysis (WHA or other).
– The parcel is under a conservation easement from an organization
accredited by the Land Trust Alliance and the building envelope has
already been identified in the recorded documents.
– The parcel is in a pre-existing platted neighborhood/subdivision and
is < 3 acre in size.
– The project is in an existing building envelope on the parcel.
– The project is for additional development fully contained within 50 feet
of existing development on the parcel.
In addition, The parcel is exempt from the need for a WHA or A-WHA if all three of the
following conditions apply:
– The parcel is in a pre-existing platted neighborhood/subdivision and
is > 3 acres and < 5 acres in size.
– The parcel is covered only by the “Big Game Migration Corridor &
Seasonal Range” layer of the NRO.
– The parcel has no USGS-designated perennial, seasonal or
intermittent stream courses present.
Breaking that down, the most likely scenario are properties that are in existing platted subdivisions and are less than 3 acres in size. Additionally, if the project is inside an existing building envelope, that could easily mitigate the requirement for one of these analyzes. Remodels should also be protected if the additional development is fully contained within 50 ft of existing development on the parcel. We do our best to provide resources that include approved contractors for these types of analysis on our brokerage website, make sure to make an account with one of our agents, and again, always confirm this information.


