Teton Realty Blog

Teton Region Real Estate Market Stats, Articles & News

  • Home
  • Listings ‘N Stuff
    • Property Search
    • Search Account
  • The Blog
    • Buyers
    • Sellers
    • Local Info
    • Market Reports
    • Know Your Home
    • 2022 Teton County, ID Code
    • Pages & Categories
  • About/Contact Me
    • Contact Me
    • About Me
    • Testimonials
  • Log In/Subscribe
    • Account Set-Up/Log-In
    • Weekly Newsletter
  • Facebook
  • LinkedIn
  • YouTube

Floodplain, who’s in charge, and what does it mean?

May 2, 2025 By Tayson Rockefeller Leave a Comment

For some reason, of all the “layers” encompassing lands throughout Teton Valley (or anywhere else), floodplain has always been the most difficult for me to understand. Merriam-Webster defines floodplain as “level land that may be submerged by floodwaters, or a plain built up by stream deposition.” To me, floodplain isn’t necessarily always flat, but it isn’t the definition that I struggle with. It more has to do with what it means for those that have floodplains indicated on their property.

Before I go any further here, and with my preface out of the way, I STILL struggle with floodplain. With that—and all articles I have written over the years—take this with a grain of salt. These are my interpretations about complex issues, and I have no authority on these matters. Always do your own research through proper authoritative agencies.

Tayson’s definition of floodplain, and the purpose of having this information:

I don’t think anybody’s really struggling with the definition here, but to expand: Floodplain, as I understand it, is determined through elevation (obviously the low-lying areas are going to accumulate water), hydrology (how water moves), and soil types. For example, in a past article I talked about attending a FEMA open house at the Teton County Courthouse, which detailed how this data is collected and how the County is working with FEMA to update its flood maps. As of this writing, the appeal period for those wishing to contest the proposed maps is closing, paving the way for final approval of the new, more accurate flood zones and associated maps.

The purpose of having this data:

To me, the greatest benefit of having this information is to mitigate risk. In a real-life scenario, I don’t think that Merriam-Webster’s definition works to describe potential areas of risk. Since water moves in precarious ways, we can hope to rely on science and data to give us that clearer picture of areas of risk. This can then be used for landowners to plan new projects or mitigate risk with existing structures. It’s also used by insurance companies—particularly those participating in the National Flood Insurance Program—to assess flood risk and determine insurance requirements. As I understand it, the NFIP is a federal program managed by FEMA that provides flood insurance to property owners, renters, and businesses, and it relies heavily on FEMA’s floodplain maps to assess risk and set insurance rates.

How the data is obtained and displayed:

Again, no expert here, but I do know that the latest information available was provided through LiDAR flyovers to gather contours and terrain, as well as hydrologic and soil studies to model how water moves and flows. Because of the level of technology, these maps can display not only areas of concern but also different levels of risk in certain areas. Historically, my understanding was that the primary defined areas of risk included 100-year and 500-year flood risk areas. I also understand that new efforts are being made to display this risk through percentages as opposed to yearly events, so as not to confuse the intended definition of that risk.

As an example, a property in a 500-year flood risk area does not necessarily mean it will only flood once every 500 years. Describing that same risk as a 0.2% annual chance of flooding conveys the same statistical probability, but in a way that more clearly communicates the level of risk. Similarly, a 100-year flood event area might also be described as having a 1% annual chance of flooding. Because of the advanced technology used to gather this new data, additional flood risk areas can also be defined—but it’s important to remember that these are estimates based on modeling. Obviously, anything can happen.

Who creates the maps?

The maps themselves are generally created through FEMA (Federal Emergency Management Agency) in cooperation with the National Flood Insurance Program (NFIP) and local jurisdictions. FEMA contracts with engineering firms and works with local governments to ensure maps reflect both scientific modeling and local conditions. These are the same maps used for regulating development in flood-prone areas and determining flood insurance requirements.

Can the information be challenged?

As advanced as this data might be, it is broadly used across great areas of landscape. As a result, property owners or developers may have the opportunity to challenge this data through site-specific engineering to determine the exact elevation of a structure relative to the projected floodwaters. This is typically done through an elevation study, which can then be used to produce an Elevation Certificate. While this certificate is often required for determining compliance with building standards or securing flood insurance, it can also be submitted to FEMA to support a request to remove a structure from a mapped high-risk zone.

In some cases, more formal map changes are needed. A Letter of Map Amendment (LOMA) can be requested when a property owner believes their structure or lot was incorrectly included in a flood zone. These are often supported by Elevation Certificates and typically apply to individual lots or structures. For larger-scale changes—such as those affecting an entire development or subdivision—a Letter of Map Revision (LOMR) may be appropriate. These tools can be essential for developers and landowners when building or remodeling near designated floodplains.

What is the County’s role?

In the event that there is development in a floodplain, the County’s policy (as I interpreted during a meeting with the County on the subject) was for structures to be a minimum of one foot above freeboard.

In that meeting, they referred to something called “freeboard,” which, as it turns out, is a nautical term. In boating, freeboard is the distance between the waterline and the edge of the boat—basically the buffer that keeps water from spilling in. In the floodplain world, it’s a similar idea. Freeboard refers to the extra height that structures need to be built above the projected flood level. It gives a bit of wiggle room for things like model inaccuracies or bigger-than-expected storms. In Teton County, that buffer is currently set at one foot above the base flood elevation for any development in a flood zone, though which zone this applies to should be clarified prior to any construction.

Additionally, the representative in the meeting stated that the County does maintain some generic latitude, which might include looking at developable areas on a building site that may not be in the floodplain. There are also considerations when it comes to vegetation removal in instances of development in or around a floodplain, understanding that removing vegetation can also impact these waterways. Because I have not been able to point to any specific area of the code to identify the County’s requirements in addition to those set forth or recommended by FEMA, it is important to remember to consult with industry professionals and engineers, and to work directly with the planning and zoning and/or building departments to understand what’s allowed, and what’s required.

Q1 2025 Residential Market Report & Lookback

April 15, 2025 By Tayson Rockefeller Leave a Comment

It’s been awhile since we’ve given a full comprehensive market report of data over several years, so we felt it was high time, particularly with recent market volatility, stubborn interest rates, and an overall sense of a new market emerging from the craziness post COVID.

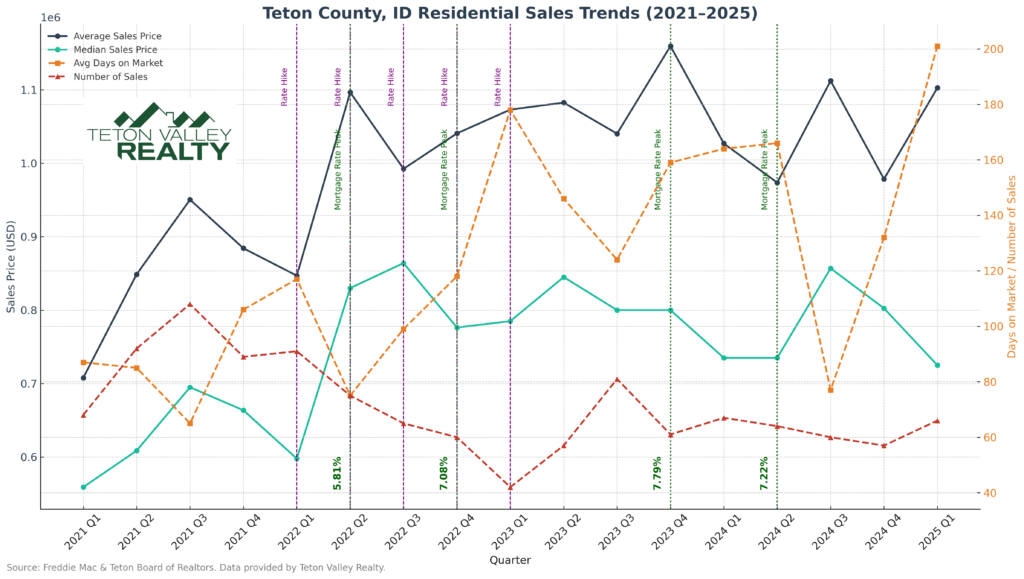
Using data since the first quarter of 2021 through the first quarter of 2025, we put together a graph with all of the data. While it might appear to be a jumble of information, let’s try to break it down.

Rate Hikes

The vast majority of the rate hikes occurred in 2022, so we indicated those with vertical lines. In the first quarter of 2022, we saw the first rate hike since 2018, followed by two rate hikes in Q2 2022, two rate hikes in Q3 and a another rate hike in Q4 of 2022. 2023 and onward witnessed slower hikes and pauses, but most of those were the first two quarters of 2023. The key metrics to watch here include the number of sales which decreased all through those noteworthy rate hikes, and the average days on market which increased mostly through the rate hikes, beginning with the second group of hikes – which makes sense to see this sector of the market lag behind and react to the Federal Reserve’s changes. Following those significant changes, you can see mostly just ups and downs. We’ll summarize that in greater detail below.

Average Sales Prices

The average sales price steadily increased, peaking in or around the 4th quarter of 2023, which seems about right for the market. If you ask most of our Teton Valley Realty Associates, they might agree that the top of the market was actually closer to the end of 2022, but again, it does not seem unusual to see a little bit of a delay here. While the average sales price ended on a high note in the first quarter of 2025, average numbers are easily skewed by large single transactions. A much easier picture to follow is the median sales price, which declined over the past few quarters back after a peak in Q3 2022 (more closely following the team’s sentiment). Similarly, about the time we saw those median sales prices decline, the average days on market again increased, ending at an all time high at the end of the first quarter in 2025.

Median Sales Prices

The median sales price saw its first significant increase, ironically after the rate hikes had begun. This seems to be the most delayed sector of the data from what we can interpret, but there was an area of confusion post COVID where prices (and people) really didn’t know where they were ultimately going to land, seeming to establish themselves with a high point in the third quarter of 2022, which is likely why many of our team Associates felt that was the peak of the market. There was an interesting surge during the third quarter of 2024, possibly due to rate decreases. This aligned with an inversion of the days on market, which sank nearly to a low point during that quarter in 2024.

Number of Sales

This data isn’t too conclusive, other than we saw the inventory bottom out at the end of the most significant rate hikes towards the end of 2023. We aren’t attributing this data to rate hikes, rather inventory diminishing as a result of increasing build costs and a continued strong Seller’s market. This again stabilized in 2023 and beyond, the point at which our team felt we were out of the “COVID era” and into a new market.

Summary, What’s in Store

Obviously, there’s no data to support what we might be in for, though broader market volatility has seemed to have put a short-term damper on sales. However, an interesting (small) bump in the first quarter of 2025 is noteworthy. Looking back through these first quarter milestones on the graph, however, you can see a surge at or around the first quarter of every year. This might be indicative of year end sales coming to a close, or a longer term trend. It’s not unusual for two peak seasons to dictate the greatest number of sales in our market, with the obvious ski season and busy Summer tourist seasons producing contracts, with sales to follow. Overall, we feel that there are a few things working for the real estate market’s continued growth, and a few things working against. Real estate “bulls” might argue that stock market investors might lose confidence and look to real estate for investment opportunities. Additionally, relief for interest rates is likely on the horizon, which could drive more sales. “Bears” would likely look at the overall market’s (stocks, bonds, real estate, etc.) sentiment and volatility trickling down to the real estate market after a long run of significant sales dollars and volume.

📚 Resources & References
📊 Real Estate Sales Data
Teton Valley Realty

Internal data on average and median sales prices, number of residential sales, and average days on market by quarter.

Teton Board of Realtors

MLS statistics for Teton County, Idaho.

💸 Federal Reserve Interest Rate Hikes
Federal Reserve – FOMC Meeting Statements & Historical Decisions
https://www.federalreserve.gov/monetarypolicy.htm

Tracked key interest rate increases during 2022 and early 2023, including:

March 2022: +0.25%

May 2022: +0.50%

June, July, Sept, Nov 2022: Multiple +0.75% hikes

🏦 30-Year Fixed Mortgage Rate Peaks
Freddie Mac – Primary Mortgage Market Survey (PMMS)
https://www.freddiemac.com/pmms

Used to identify weekly mortgage rate peaks. Notable peaks include:

June 23, 2022: 5.81%

Oct. 20 & Nov. 3, 2022: 7.08%

Oct. 19, 2023: 7.79% (highest in over 20 years)

May 2, 2024: 7.22%

📰 News Commentary & Mortgage Rate Analysis
Barron’s, CNBC, Mortgage News Daily

Provided additional commentary on market reactions to rate movements and borrowing impacts.

HOAs vs Pragmatism

April 3, 2025 By Tayson Rockefeller Leave a Comment

An interesting dynamic that has emerged over the years is the unanticipated change in lifestyle, business practices, zoning updates, county regulations, and state regulations affecting simple, common-sense aspects of everyday living.

One of the most common examples I have referenced over the years is short-term rental regulations. Idaho legislation is widely known for protecting property rights, including the right to rent a home—more specifically, for short-term or vacation rentals. There is, however, a provision allowing homeowners associations (HOAs) to prohibit short-term rentals (typically defined as stays of 30 nights or fewer). The issue is that most of Teton Valley’s new subdivisions were established around 2007, during the last real estate boom. While there was a vacation rental industry at that time, it was still in its early stages. I recall that our in-house property management firm, Teton Valley Property Management, initially used reservation software similar to what a hotel might use. The industry didn’t truly take off until the last real estate boom, coinciding with Airbnb’s launch in 2008.

Many new subdivisions during that period copied previous development covenants and restrictions, making only slight modifications to fit the new developments. As a result, they often failed to account for the potential rise of short-term rentals, even if the original intent was to prevent them. Consequently, nearly every subdivision in Teton Valley allows short-term rentals. Since the last real estate boom, new communities have been established, though they have become less frequent due to zoning density changes and new subdivision requirements. Even so, new developers typically avoid prohibiting rentals out of fear of alienating potential buyers who may see rental income as an advantage.

While the longstanding controversy over short-term rentals is an easy topic to discuss, there are other noteworthy examples of the tension between HOA restrictions and evolving realities.

Environmental Changes

I think we can all generally agree that climate change is real at this point. While this isn’t a topic I typically cover in my neutral real estate blog, it does relate to issues like wildfire resistance. Some communities still require natural wood siding and even shake shingle roofs. As of this writing, Teton Valley has been fortunate to avoid dramatic increases in insurance rates and has experienced very few natural disasters. However, a brush fire in 2024 was one of the first significant fires within the valley in my memory. Despite this, some subdivisions continue to resist changes that would allow for more fire-resistant building materials.

Build-Out and Subdivision Maturity

Issues tend to arise as subdivisions develop. It’s surprising how many communities in Teton Valley remain mostly or partially undeveloped, often due to land investors holding onto property, even if it is just to own a “piece” of Teton Valley. However, some communities are beginning to build out rapidly. While 2007 was a land development boom, the recent uptick in Teton Valley has primarily been in residential development.

Fortunately, most property owners have been considerate of their neighbors when developing. For example, in Teton View corridor neighborhoods without designated building envelopes, many owners stagger their homes to preserve both their own views of the Tetons and those of their neighbors. Even when unintentional, local knowledge of the landscape and architectural intuition tend to guide development in a way that takes advantage of the surrounding beauty. However, this isn’t always the case. Not all property owners are neighborly, and some development factors were not thoroughly vetted during the planning process. I’ve seen multiple subdivisions require amendments to plat maps or building envelopes to accommodate practical adjustments. While HOAs are often cooperative in such cases—particularly when county variances require it—the process of amending subdivision documents can be cumbersome, especially when no formal association has been established.

Zoning Changes

This is the big one. In August 2022, the county introduced an entirely new land development code and zoning map. This update cut densities nearly in half, revised overlays, and altered development processes. While existing parcels were grandfathered in terms of density (for example, a properly subdivided 2.5-acre parcel now within a 5-acre density zone remains buildable), other changes present challenges. Here are a few key examples:

Scenic Corridor Overlay

The new scenic corridor overlay affects properties within 500 feet of Ski Hill Road. Under the new regulations, landowners may need to modify development plans to comply with overlay requirements. The county does not enforce subdivision covenants, conditions & restrictions, but its development guidelines supersede those of subdivisions. This can create conflicts when subdivision guidelines contradict county zoning restrictions. Fortunately, the county often grants variances to accommodate developers and subdivisions, though it adds an extra layer of complexity.

Wildlife Overlay

Zoning changes have also impacted properties within designated wildlife and natural resource overlays. While most subdivision parcels under five acres are now exempt from additional requirements, some still face complications. For example, an overlay may sit directly on a planned building site, requiring a variance or adjustment that could conflict with existing subdivision plats.

Wetland and Floodplain Overlays

These overlays have been revised, and riparian buffer setbacks have increased. Even if a wetland delineation was approved years ago, the Army Corps of Engineers has expiration timelines for delineation approvals. As a result, landowners may find that new setbacks prohibit development in previously intended areas. Again, variances are possible, but they add another hurdle for landowners and developers.

Setback Requirements

Simple setback changes can also cause issues. Some subdivisions were designed with minimal setbacks based on previous zoning regulations. If the required setbacks have increased, buildable areas may be reduced, making development more difficult.

Why Not Simply Modify HOA Covenants?

Given these challenges, one might ask: why not update subdivision covenants and HOA policies? While this seems like a logical solution, it is often easier said than done. Many subdivision bylaws require a majority—or even a supermajority—of homeowners to approve amendments. This typically necessitates board meetings, formal votes, and recorded signatures. In my experience, this is a difficult process. Many investors and homeowners are resistant to change, especially if it could affect property values, rental income, or architectural consistency within a community.

Final Thoughts

Despite these challenges, it’s important to note that very few lots are significantly impacted by zoning or covenant conflicts. Still, prospective buyers and developers should carefully review subdivision documents and reach out to HOA representatives when possible. While these changes introduce new complexities, I believe that practical solutions will emerge over time. County officials have reassured me that properly subdivided parcels remain buildable, even if new regulations introduce obstacles. Additional challenges—such as septic system requirements in wet areas and rising construction costs—may also arise.

Teton Valley is still in the early stages of its growth, despite the substantial expansion we’ve seen. I anticipate further zoning updates, new comprehensive plans, and evolving industry standards will continue to shape the landscape (no pun intended). But if history is any indication, just like past controversial real estate issues in Teton Valley, my prediction remains simple: things will work themselves out.

Summer 2024 Market Update

July 13, 2024 By Tayson Rockefeller Leave a Comment

Since this is technically a blog article and my market updates live in a separate section over at TetonValleyRealty.com, I’m going to treat this market update more like a blog post, just to convey my general feelings and sentiment of the market.

Residential

The residential sector of the market in Teton Valley and surrounding counties (Teton County, Wyoming and Lincoln County, Wyoming) all share similar attributes and challenges, though at different price points.

Dare I call any sector of the residential market “starter homes” (considering the average residential sales price in the Teton regional MLS is well over a million bucks) this sector of the market seems to be accumulating the most days on market and is faced with the greatest challenges. Why? Back to that average sales price. While the average sales price in communities like Teton Valley and Alpine are under 1m, they are still big numbers. Combined with interest rates which remain stubbornly high, we are beginning to see Summer price reductions. In other words, residential listings priced under 1.2m in the bedroom communities or maybe 2m in the Jackson area (which generally excludes the luxury/second home market), are faced with the most difficult sector of the market today. Despite this seemingly grim data for Sellers, inventory is still extremely limited, and opportunities that fit the bill for most consumers are still few and far between.

The luxury market in all sectors (once again, at different price points depending on the micro market) seems to still be churning along, if impacted by nothing other than increasing inventory, primarily due to more builders jumping into the game, or at least focusing on projects of this caliber. Many similar models I have sold for builders have crept up ever so slightly in terms of price, but the market seems to be fairly stable. Summer inventory does seem to be further increasing, which could have a slight impact as the market stabilizes from the short-term yet jarring effects of the Teton pass closing, and the speculation of long-term closure, now behind us. 

Condos and townhouses are certainly plentiful, but inventory is slowly being absorbed. While I felt we were at a high point in terms of supply towards the end of last year and into the Spring, it does seem that that market is stabilizing. 

Predictions; to summarize, it’s obviously still difficult to see where the general economy takes us with inflation seeming to cool but interest rates remaining stubborn. For those that have been waiting to jump in, the message from many of the lenders in the marketplace has been to jump in now while Sellers in the “starter home” price point are vulnerable, taking advantage of lower interest rates when a refinance is realistic. That sentiment may have been a little premature a year ago, but it does seem that inflation is cooling and rates are likely to soon decrease. The “covid craze” seems to be subsiding, and some sellers appear to be faced with, and accepting reality in that regard. I know that many Buyers are waiting for a correction, but from my perspective, I hear fewer that believe this is soon to happen than those that think it won’t happen anytime soon.

Land

I have long said that the land market seemed to have stabilized towards the end of 2021, with the tremendous gains capped by new inventory and market stabilization. I still see small spikes and valleys in those trends in specific areas, the Teton view corridor is a good example. Ample supply (though unusual in these areas) can reduce overall prices, while limited availability can have the opposite effect, but in an even more dramatic way. Other parcels with some form of unusual feature can also benefit from limited supply, such as industrial zoned land, land without covenants and restrictions, land with interesting terrain, water features, trees or otherwise have all seen greater increases. Some areas, however, have seen greater instances of stabilization or even a slowdown, particularly those that lack any unique aspects or reside in communities with strict guidelines that require more expensive builds. 

Construction

As an aside and in line with the last sentence above, construction costs have remained surprisingly resilient to cooling and inflation. While some materials have reduced in cost, others have increased. Subcontractors are showing no signs of slowing down in terms of cost increases, which tells me that there is still plenty of work on the horizon. Many local governments have been inundated with new custom and speculative bills and just like the huge cost increases in terms of construction costs keeping new projects at bay, the difficulty in obtaining building permits, combined with stubborn construction costs has kept new inventory from exploding. It’s frustrating for builders and investors, but it’s probably keeping the market under control at the same time.

  • 1
  • 2
  • 3
  • Next Page »

Recent Testimonials

  • Douglas V.
  • Chuck M.
  • Terry & Joy K.
Teton Valley Realty
Copyright Teton Realty Blog© 2025 - Tayson Rockefeller - [email protected] - 208-709-1333 - sitemap | Privacy Policy, Copyright & Terms of Use