Teton Realty Blog

Teton Region Real Estate Market Stats, Articles & News

  • Home
  • Listings ‘N Stuff
    • Property Search
    • Search Account
  • The Blog
    • Buyers
    • Sellers
    • Local Info
    • Market Reports
    • Know Your Home
    • 2022 Teton County, ID Code
    • Pages & Categories
  • About/Contact Me
    • Contact Me
    • About Me
    • Testimonials
  • Log In/Subscribe
    • Account Set-Up/Log-In
    • Weekly Newsletter
  • Facebook
  • LinkedIn
  • YouTube

Floodplain, who’s in charge, and what does it mean?

May 2, 2025 By Tayson Rockefeller Leave a Comment

For some reason, of all the “layers” encompassing lands throughout Teton Valley (or anywhere else), floodplain has always been the most difficult for me to understand. Merriam-Webster defines floodplain as “level land that may be submerged by floodwaters, or a plain built up by stream deposition.” To me, floodplain isn’t necessarily always flat, but it isn’t the definition that I struggle with. It more has to do with what it means for those that have floodplains indicated on their property.

Before I go any further here, and with my preface out of the way, I STILL struggle with floodplain. With that—and all articles I have written over the years—take this with a grain of salt. These are my interpretations about complex issues, and I have no authority on these matters. Always do your own research through proper authoritative agencies.

Tayson’s definition of floodplain, and the purpose of having this information:

I don’t think anybody’s really struggling with the definition here, but to expand: Floodplain, as I understand it, is determined through elevation (obviously the low-lying areas are going to accumulate water), hydrology (how water moves), and soil types. For example, in a past article I talked about attending a FEMA open house at the Teton County Courthouse, which detailed how this data is collected and how the County is working with FEMA to update its flood maps. As of this writing, the appeal period for those wishing to contest the proposed maps is closing, paving the way for final approval of the new, more accurate flood zones and associated maps.

The purpose of having this data:

To me, the greatest benefit of having this information is to mitigate risk. In a real-life scenario, I don’t think that Merriam-Webster’s definition works to describe potential areas of risk. Since water moves in precarious ways, we can hope to rely on science and data to give us that clearer picture of areas of risk. This can then be used for landowners to plan new projects or mitigate risk with existing structures. It’s also used by insurance companies—particularly those participating in the National Flood Insurance Program—to assess flood risk and determine insurance requirements. As I understand it, the NFIP is a federal program managed by FEMA that provides flood insurance to property owners, renters, and businesses, and it relies heavily on FEMA’s floodplain maps to assess risk and set insurance rates.

How the data is obtained and displayed:

Again, no expert here, but I do know that the latest information available was provided through LiDAR flyovers to gather contours and terrain, as well as hydrologic and soil studies to model how water moves and flows. Because of the level of technology, these maps can display not only areas of concern but also different levels of risk in certain areas. Historically, my understanding was that the primary defined areas of risk included 100-year and 500-year flood risk areas. I also understand that new efforts are being made to display this risk through percentages as opposed to yearly events, so as not to confuse the intended definition of that risk.

As an example, a property in a 500-year flood risk area does not necessarily mean it will only flood once every 500 years. Describing that same risk as a 0.2% annual chance of flooding conveys the same statistical probability, but in a way that more clearly communicates the level of risk. Similarly, a 100-year flood event area might also be described as having a 1% annual chance of flooding. Because of the advanced technology used to gather this new data, additional flood risk areas can also be defined—but it’s important to remember that these are estimates based on modeling. Obviously, anything can happen.

Who creates the maps?

The maps themselves are generally created through FEMA (Federal Emergency Management Agency) in cooperation with the National Flood Insurance Program (NFIP) and local jurisdictions. FEMA contracts with engineering firms and works with local governments to ensure maps reflect both scientific modeling and local conditions. These are the same maps used for regulating development in flood-prone areas and determining flood insurance requirements.

Can the information be challenged?

As advanced as this data might be, it is broadly used across great areas of landscape. As a result, property owners or developers may have the opportunity to challenge this data through site-specific engineering to determine the exact elevation of a structure relative to the projected floodwaters. This is typically done through an elevation study, which can then be used to produce an Elevation Certificate. While this certificate is often required for determining compliance with building standards or securing flood insurance, it can also be submitted to FEMA to support a request to remove a structure from a mapped high-risk zone.

In some cases, more formal map changes are needed. A Letter of Map Amendment (LOMA) can be requested when a property owner believes their structure or lot was incorrectly included in a flood zone. These are often supported by Elevation Certificates and typically apply to individual lots or structures. For larger-scale changes—such as those affecting an entire development or subdivision—a Letter of Map Revision (LOMR) may be appropriate. These tools can be essential for developers and landowners when building or remodeling near designated floodplains.

What is the County’s role?

In the event that there is development in a floodplain, the County’s policy (as I interpreted during a meeting with the County on the subject) was for structures to be a minimum of one foot above freeboard.

In that meeting, they referred to something called “freeboard,” which, as it turns out, is a nautical term. In boating, freeboard is the distance between the waterline and the edge of the boat—basically the buffer that keeps water from spilling in. In the floodplain world, it’s a similar idea. Freeboard refers to the extra height that structures need to be built above the projected flood level. It gives a bit of wiggle room for things like model inaccuracies or bigger-than-expected storms. In Teton County, that buffer is currently set at one foot above the base flood elevation for any development in a flood zone, though which zone this applies to should be clarified prior to any construction.

Additionally, the representative in the meeting stated that the County does maintain some generic latitude, which might include looking at developable areas on a building site that may not be in the floodplain. There are also considerations when it comes to vegetation removal in instances of development in or around a floodplain, understanding that removing vegetation can also impact these waterways. Because I have not been able to point to any specific area of the code to identify the County’s requirements in addition to those set forth or recommended by FEMA, it is important to remember to consult with industry professionals and engineers, and to work directly with the planning and zoning and/or building departments to understand what’s allowed, and what’s required.

But… That Lot is Smaller!

November 27, 2023 By Tayson Rockefeller Leave a Comment

I know I have written about this before, and I’m sure there is an article buried in the archives harping on the same issues here, but I think it’s an important topic.

Whether you are a Seller looking to value your own land, or a Buyer looking to acquire land of your own in the Tetons, understanding what impacts value is extremely important. This comes up time and again, particularly when it comes to the size of a parcel when compared with another. While the size of a parcel can obviously have an impact on value, it may not always be as much as you think. As an example, the difference in value of a 2.5 acre parcel compared with a 3.2 acre parcel (despite a 20%+ difference) will often be negligible. To further elaborate the example, the value of a 1 acre parcel adjacent to a 2.5 acre parcel in the same development may not only be negligible, but in many cases the smaller parcel could carry significantly more value. With that being said, let’s go through my list of value considerations when comparing parcels or lots that are otherwise “like in kind”, such as those in the same development, or in nearby developments.

In particular order, and of most significance to least in terms of my opinion of value, take a look, below.

1: View. While I wouldn’t necessarily always put this attribute on top, it is often of great consideration, particularly in subdivisions comprising 1-5 acre parcels, which is a typical size throughout the county. A parcel with view protection by way of building envelopes, terrain, roadways or otherwise can have significantly more value than one with some type of obstruction, or potential for obstruction. This can become even more important when it comes to Teton views.

2: Location. I’m not necessarily talking about location inside of a particular area, but location compared with another property sale or listing. A parcel adjacent to a main county or state roadway would often be considered of lesser value when compared with one nearby that might have more privacy. Location considerations can also come in the form of nearby features, which leads me to the next point.

3: Features. As indicated above, features and location often correspond with one another. A row of trees, a fire suppression pond, a berm, canal or any number of property features (which don’t necessarily need to be on the properties themselves) can impact value or bring added value.

4: Subdivision Attributes. While the property that one might be investigating may not even be in a subdivision, the chances are likely that one in the market for a building site is going to be looking at properties that are. However, not all subdivisions are created equally. Some offer advantages such as paved roads or favorable covenants and restrictions. In many cases, properties with minimal restrictions or no restrictions at all can bring more value than one with firm design criteria or subdivision restrictions. On the flip side, a development with great quality as a result of a well-organized homeowner’s association with robust design guidelines can also create an advantage compared with another nearby development that does not. These considerations can come in many different shapes and sizes. Another great example is rental restrictions.

5: Environmental or Adjacent Property Considerations. Examples can be wide-ranging, but might include high ground water which could prohibit certain construction types or add cost to construction methods, nearby factors such as farm equipment or older homes, and so on. The list can go on from here, but like many of the other considerations above, can also dovetail with some of these other listed items.

6: Size. Last, but not necessarily always least as I prefaced in the beginning of this article, size. I hope this article has made it easier to understand why acreage and its impact on value can be deceiving. Remember that a larger parcel often carries the same benefits with respect to flexibility and rights that a smaller property may have. If you’ve read many of my other articles, you’ll know that typically when it comes to subdivision parcels, most properties can accommodate a single family home and guest quarters, whether it’s 1 acre or 100 acres. Further, splitting land can challenging and oftentimes impossible. Teton County’s land development code does not provide opportunities for additional dwelling units without specific and rare zoning considerations. While size can definitely have an impact on value, it needs to be significant enough to the point that it may no longer be comparable with another property. These limitations on smaller parcels could include room for livestock, limitations on building a barn, or providing ample space for a detached guest house.

2021 Land Year End Sales Report

December 19, 2021 By Tayson Rockefeller Leave a Comment

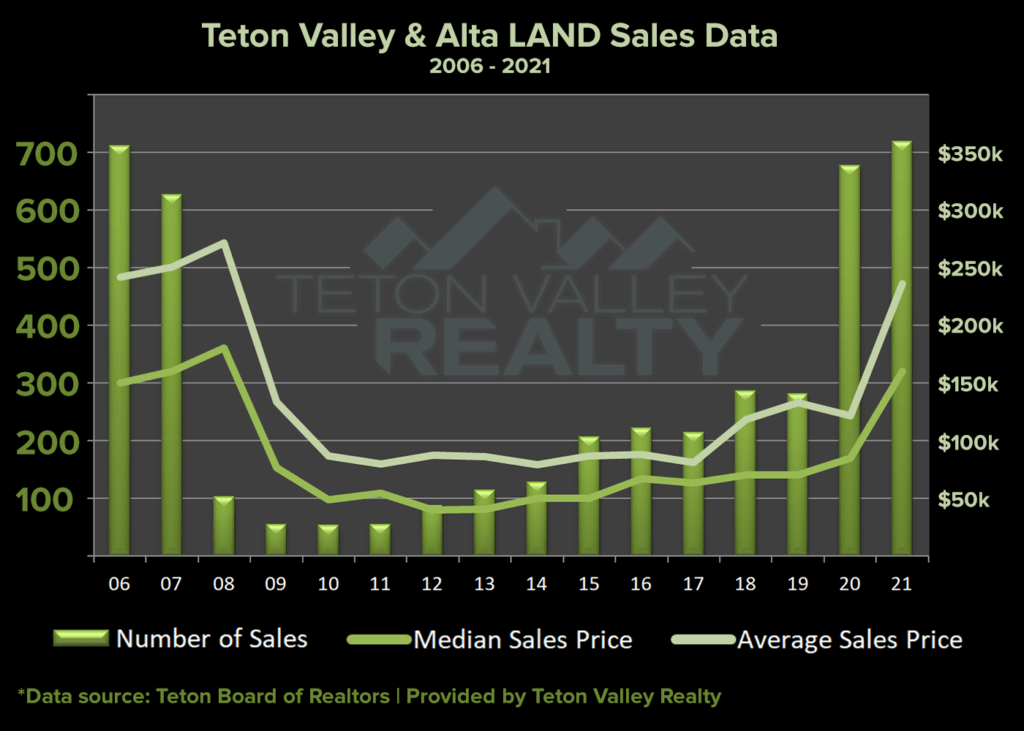
It’s that time of year again and it’s always fun to see the data. A friend suggested I prepare this in a graph style format. Naturally, I researched data from 2006 to date. For those of you reading the article as opposed to my blog or newsletter, you can probably already picture the trajectory of that graph from a high point in 2007, a low point in 2009, stagnation from 2010 to 2014, slow but increasing improvement to 2019, followed by a sharp increase in 2020. Here are my takeaways;

2008: There were 102 sales in 2008 compared to only 55 sales in 2009. Interestingly, things fell off later in the year, seeming to lag behind the rest of the Nation’s real estate trends.

2009-2012: The official recession had long been over by 2012, though land hadn’t seen much improvement in terms of the number of sales or the average sales prices during this time. These are the years with opportunities we likely won’t ever see again. I don’t attribute all of 2020’s massive gains to the usual pandemic related craze, I have always believed that land was too cheap for too long in the area.

2013-2018: This was the slow recovery stage I mentioned. It’s almost silly to think that any portion of the real estate market was still recovering this long after economic decline, but still, land prices were far cheaper than large tract land acquisition and development costs. As a result, inventory dwindled despite a huge oversupply that was attributed to the long-lasting “bargain” period.

Q1 2019 vs Q1 2020: In order to get a bit more quantifiable data I actually ran this report December 1st through March 1st (I didn’t want the pandemic in March of ’20 to impact this observation) and found that 2019 saw 37 sales with an average sales price of $188,896. One sale during that time at $3m had a big impact on that average, the median sales price was $72,000. 2020 saw 52 sales with an average of $73,064 and a median sales price of $59,000. I found it interesting that the number of sales for that quarter increased in 2020 but the median sales price decreased. For those of you looking at the graph and seeing the average sales price dip in 2020, this is likely due to the large aforementioned $3 million dollar sale that boosted that average just prior. With both land and residential the opportunity for a bargain post-pandemic before the real estate market took off was extremely short-lived. There were a few deals to be had during that time, but not many.

2021: Most real estate agents with a close ear to the ground will tell you that they feel the land market has peaked and things have stabilized as of the time of this writing, end of 2021. When looking at the data by quarter, the median sales price was Q1: $145,000, Q2: $150,000, Q3: $175,000 and Q4: $173,500. Obviously still some growth in there (until Q4), but nothing Earth shattering like we’ve been seeing.

Final Takeaway: A final interesting point should include sales prices in 2007 versus today. Interestingly, what they were nearly 15 years ago. In addition, we’ve seen 15 years of inflation and one of the hottest real estate markets in recent history. The bottom line? I believe real estate prices are currently where they should be. Bargain? No. Overvalued and otherwise a bad deal? In my view, no.

Measuring the Value of Land by Price per Acre

November 28, 2021 By Tayson Rockefeller Leave a Comment

I have been meaning to draft this article for quite some time, it is one of those articles that’s relevant in any market. That is, valuing a particular piece of property based on a cost analysis per acre. This is a measure that we will sometimes use when valuing large farm acreages. For us working in the industry, that’s usually where it stops. For others, that methodology trickles down into residential property which in my opinion, is usually not appropriate. I share this opinion with most when discussing values, but usually when customers, be it Buyers or Sellers, start forming their own opinion it’s hard to get them to change their perspective. For Buyers, it’s a way of arguing the value down, and for Sellers the opposite. I’ve heard this a few times…

Anyway. A local analogy I often use as an example is a development between Driggs and Victor. It’s really one large interconnected development with two phases, but it was organized as two separate adjoining developments that share the same rules and regulations. The East half/development comprises 2.5 acre lots and the West half comprises 1 acre lots, but there’s a catch – an important one. The current county density requirement in this area is one home (and guest home if the subdivision allows) per 2.5 acre parcel. The average density of the East development is obviously 2.5 acres. The West development also has an average density of 2.5 acres. Each 1 acre parcel is surrounded by community-owned open space that cannot be developed. Currently on market is a $190,000 1 acre parcel and a 2.5 acre parcel nearby priced at $109,000 per acre. Does that mean that the one acre parcel surrounded by open space is only worth $109,000? Obviously not.

Okay, so the above example is easy to justify. Let’s move across the valley into the Teton View corridor. To keep things fair, we need to keep the area similar. Properties East of State Highway 33 should be valued differently than those West of side of the highway. Let’s compare parcels in developments with no open space, one parcel being 2 acres and another being 5 acres. Am I saying each of these have the same value? No, but they certainly could. What I am saying is that if I were asked to value each of these parcels I wouldn’t even look at the cost per acre (yes, I would look at the overall size) of nearby listings or sales. The important thing to remember here again is that each parcel allows ONE primary home. I could compare 2.5 acre parcels with 5 acre parcels in the primary view corridor all day long and would probably find more 2.5 acre parcels that I would recommend to customers regardless of overall price or price per acre. I’m going to look at budget, proximity from the highway, property features, overall development value and restrictions and of course, the viability of an unobstructed view down the road. In other words, is it conceivable that I would value a 2.5 acre parcel and a 5 acre parcel the same? Absolutely. Does it mean I don’t take the size of a parcel into consideration? No, it does not.

The important thing to understand when determining or justifying the value of any given tract of vacant land is to remember to look at the entire picture. A 2.5 acre parcel overlooking 200 acres of an adjacent development’s open space has tremendous value. Trees, creeks, undulation in terrain, community features and amenities AND size – all of these elements should dictate the value of a parcel. It is not fair or reasonable to value any given property using just one of these metrics.

  • 1
  • 2
  • Next Page »

Recent Testimonials

  • Douglas V.
  • Chuck M.
  • Terry & Joy K.
Teton Valley Realty
Copyright Teton Realty Blog© 2025 - Tayson Rockefeller - [email protected] - 208-709-1333 - sitemap | Privacy Policy, Copyright & Terms of Use