Teton Realty Blog

Teton Region Real Estate Market Stats, Articles & News

  • Home
  • Listings ‘N Stuff
    • Property Search
    • Search Account
  • The Blog
    • Buyers
    • Sellers
    • Local Info
    • Market Reports
    • Know Your Home
    • 2022 Teton County, ID Code
    • Pages & Categories
  • About/Contact Me
    • Contact Me
    • About Me
    • Testimonials
  • Log In/Subscribe
    • Account Set-Up/Log-In
    • Weekly Newsletter
  • Facebook
  • LinkedIn
  • YouTube

Property Assessments, Are Taxes Going Through the Roof?

June 14, 2022 By Tayson Rockefeller Leave a Comment

Unless you were living under a rock for the past 2 years (which might have been nice) you probably know that property values are up significantly. Until now, we haven’t seen County assessed values follow suit. With the recent release of 2022 assessed values, many are concerned that property tax increases are soon to follow. However, this doesn’t necessarily mean that your tax bill is going to go up proportionately.


In Idaho, each county is allowed to increase its property tax budget by up to 3% of the highest property tax budget of the past 3 years. The county can also increase their budget to account for new growth.


In order to calculate the tax rate, each taxing district within the county (Teton County has 18 taxing districts that each have slightly different budgets and needs) determines a levy, or the rate of which the county will multiply the assessed value to determine each property’s annual tax bill.


As an example, let’s say that district 1 has a total budget of $900k. In 2021, the total market value of every property in district 1 is $70m. To determine the levy, we would simply divide 900k by 70m, or 1.287%. If your assessed value is $300k, we simply multiply that by 1.287% to arrive at your 2021 tax amount of $3,861.


Now, let’s run a hypothetical based on what we are seeing today. We know that the total budget is going to increase with the new growth and the state’s allowance to increase the budget by up to 3% (ahem, inflation). Let’s assume that the new budget is $990k, and the collective value of all properties has risen to a whopping $110m. Using the same math, we divide $990k by $110m and arrive at 0.9%. Your value went from $300k to $450 this year. The math puts your 2022 tax bill at $4,050. While your tax bill has risen, it hasn’t risen 150% like your assessed value has.

The good news? Property values are up, and I know an agent that would love to sell your house.

Key Dates:

  • Mid-November – Current year tax bills mailed
  • December 20th – FIRST HALF TAX PAYMENT DUE
  • March 15th – Agricultural Exemption Applications Due
  • April 15th – Application deadline for Hardship Tax Relief or Circuit Breaker Program
  • April 15th – Application deadline for Homeowner’s Exemption
  • June 20th – SECOND HALF TAX PAYMENT DUE
  • First Monday in June – Assessment notices sent out
  • Last Monday in June – Last day to appeal current year’s property values
  • Summer – County begins planning budget for following year
  • Second Monday in September – County certifies budget
Application for Agricultural Exemption

Agricultural Lease Agreement

Interest Rates, Ideas for Buyers and Market Impacts

May 6, 2022 By Tayson Rockefeller Leave a Comment

It’s no secret, interest rates are definitely on the rise, and likely will continue to do so. It’s interesting hearing about all of the potential impacts. A lender friend of mine provided some good insight recently. Interest rates are still very low from a historical standpoint, and there are still some great ways to minimize the impacts of rising rates. These include mortgage points that come with a variety of options and the ability to have these points negotiated into a transaction or even paid by the seller. A mortgage point is effectively a way to buy down the interest rate up front. This can be a great tool to help buyers keep up with today’s real estate prices, which don’t seem to be going down despite interest rates creeping up. Buying mortgage points can also work well for buyers that intend to keep their loans long-term. Typically a “point” is equivalent to 1% of the purchase price and that will usually reduce the interest rate anywhere from 1/8 to 3/8 of a percent. Other options include a 2-1 (or even a 3-2-1) buy down which reduces the first year by 2 points in the second year by one point, which is where the highest amount of interest is paid on a loan while the principal of balance is still high.

Obviously interest increases are coming as a way to combat inflation, and it’s probably the lesser of two evils. Interestingly, supply chain issues, high building costs and other factors on the supply side are keeping new inventory at bay. Whereas real estate is primarily supply and demand based, this has created an interesting dynamic for both buyers and sellers. Personally, I do believe that the cumulative total of these issues will have an impact on the market, but without the increase of supply, I’m interested to see how much (if any, I should add).

Marketing Backfires in a Seller’s Market

January 26, 2022 By Tayson Rockefeller Leave a Comment

Notwithstanding some recent market volatility, looming interest rate hikes and other noteworthy news headlines, supply remains incredibly low and demand is as high as ever here in Teton Valley. While the market likely won’t always be in this predicament, I believe this advice will remain pertinent for many market cycles to come.

Getting back to the subject line here, we’ve grown accustomed to allowing the market to “autocorrect” when it comes to listing properties, at least listing them too low. If we know the last sale for something was $100,000, and it was more than a couple of months ago, we usually anticipate multiple offers at or above that number. With this consideration I arrive at my first no-no;

Listing too high

This can be a delicate balance, particularly when we know that the market increases month by month. We almost have to anticipate how much it has increased but not overshoot. Overshooting typically results in “days on market”, and the general conclusion by the public is that there is something wrong with the property. Days on market can be normal in normal markets, but detrimental in hot markets.

Anticipating multiple offers

I’ve seen this one happen a few times over the past 12 months. Just because the market is hot doesn’t mean that it can’t be eclipsed by random happenings. Real estate markets always come and go in waves and cycles. It’s strange how everybody looks at real estate at the same time, and oftentimes we find that people aren’t looking at the same time. Marketing a property stating that you are “accepting offers through Tuesday at noon” when you don’t actually have an offer might deter the only person looking at the house.

Overdoing itThis one’s hand in hand with the scenario above, but overdoing it can sometimes create a marketing issue. For example, scheduling an open house with a tagline of “multiple buyers expected, showings limited between 12 to 3:00” might also detour someone that isn’t interested in bidding against multiple buyers, even when there aren’t multiple buyers. Scheduling too many open houses is also a signal that the activity was less than expected, almost as if sellers are begging for buyers, we don’t want to give that impression.

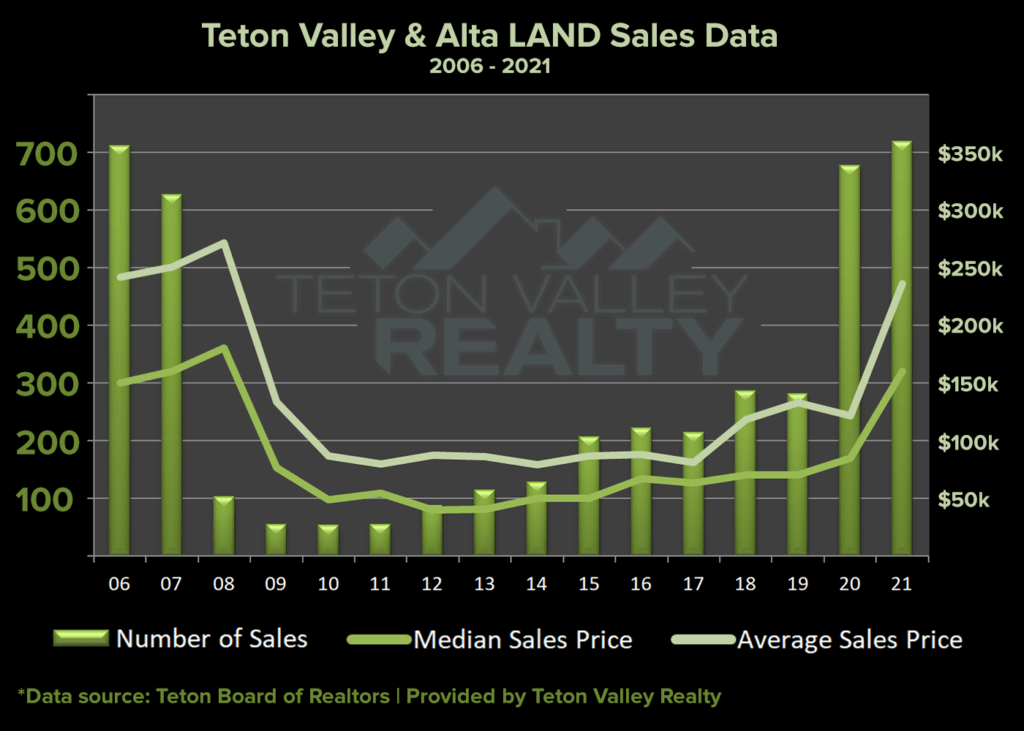
2021 Land Year End Sales Report

December 19, 2021 By Tayson Rockefeller Leave a Comment

It’s that time of year again and it’s always fun to see the data. A friend suggested I prepare this in a graph style format. Naturally, I researched data from 2006 to date. For those of you reading the article as opposed to my blog or newsletter, you can probably already picture the trajectory of that graph from a high point in 2007, a low point in 2009, stagnation from 2010 to 2014, slow but increasing improvement to 2019, followed by a sharp increase in 2020. Here are my takeaways;

2008: There were 102 sales in 2008 compared to only 55 sales in 2009. Interestingly, things fell off later in the year, seeming to lag behind the rest of the Nation’s real estate trends.

2009-2012: The official recession had long been over by 2012, though land hadn’t seen much improvement in terms of the number of sales or the average sales prices during this time. These are the years with opportunities we likely won’t ever see again. I don’t attribute all of 2020’s massive gains to the usual pandemic related craze, I have always believed that land was too cheap for too long in the area.

2013-2018: This was the slow recovery stage I mentioned. It’s almost silly to think that any portion of the real estate market was still recovering this long after economic decline, but still, land prices were far cheaper than large tract land acquisition and development costs. As a result, inventory dwindled despite a huge oversupply that was attributed to the long-lasting “bargain” period.

Q1 2019 vs Q1 2020: In order to get a bit more quantifiable data I actually ran this report December 1st through March 1st (I didn’t want the pandemic in March of ’20 to impact this observation) and found that 2019 saw 37 sales with an average sales price of $188,896. One sale during that time at $3m had a big impact on that average, the median sales price was $72,000. 2020 saw 52 sales with an average of $73,064 and a median sales price of $59,000. I found it interesting that the number of sales for that quarter increased in 2020 but the median sales price decreased. For those of you looking at the graph and seeing the average sales price dip in 2020, this is likely due to the large aforementioned $3 million dollar sale that boosted that average just prior. With both land and residential the opportunity for a bargain post-pandemic before the real estate market took off was extremely short-lived. There were a few deals to be had during that time, but not many.

2021: Most real estate agents with a close ear to the ground will tell you that they feel the land market has peaked and things have stabilized as of the time of this writing, end of 2021. When looking at the data by quarter, the median sales price was Q1: $145,000, Q2: $150,000, Q3: $175,000 and Q4: $173,500. Obviously still some growth in there (until Q4), but nothing Earth shattering like we’ve been seeing.

Final Takeaway: A final interesting point should include sales prices in 2007 versus today. Interestingly, what they were nearly 15 years ago. In addition, we’ve seen 15 years of inflation and one of the hottest real estate markets in recent history. The bottom line? I believe real estate prices are currently where they should be. Bargain? No. Overvalued and otherwise a bad deal? In my view, no.

  • « Previous Page
  • 1
  • …
  • 4
  • 5
  • 6
  • 7
  • 8
  • …
  • 22
  • Next Page »

Recent Testimonials

  • Douglas V.
  • Chuck M.
  • Terry & Joy K.
Teton Valley Realty
Copyright Teton Realty Blog© 2025 - Tayson Rockefeller - [email protected] - 208-709-1333 - sitemap | Privacy Policy, Copyright & Terms of Use