Teton Realty Blog

Teton Region Real Estate Market Stats, Articles & News

  • Home
  • Listings ‘N Stuff
    • Property Search
    • Search Account
  • The Blog
    • Buyers
    • Sellers
    • Local Info
    • Market Reports
    • Know Your Home
    • 2022 Teton County, ID Code
    • Pages & Categories
  • About/Contact Me
    • Contact Me
    • About Me
    • Testimonials
  • Log In/Subscribe
    • Account Set-Up/Log-In
    • Weekly Newsletter
  • Facebook
  • LinkedIn
  • YouTube

Floodplain, who’s in charge, and what does it mean?

May 2, 2025 By Tayson Rockefeller Leave a Comment

For some reason, of all the “layers” encompassing lands throughout Teton Valley (or anywhere else), floodplain has always been the most difficult for me to understand. Merriam-Webster defines floodplain as “level land that may be submerged by floodwaters, or a plain built up by stream deposition.” To me, floodplain isn’t necessarily always flat, but it isn’t the definition that I struggle with. It more has to do with what it means for those that have floodplains indicated on their property.

Before I go any further here, and with my preface out of the way, I STILL struggle with floodplain. With that—and all articles I have written over the years—take this with a grain of salt. These are my interpretations about complex issues, and I have no authority on these matters. Always do your own research through proper authoritative agencies.

Tayson’s definition of floodplain, and the purpose of having this information:

I don’t think anybody’s really struggling with the definition here, but to expand: Floodplain, as I understand it, is determined through elevation (obviously the low-lying areas are going to accumulate water), hydrology (how water moves), and soil types. For example, in a past article I talked about attending a FEMA open house at the Teton County Courthouse, which detailed how this data is collected and how the County is working with FEMA to update its flood maps. As of this writing, the appeal period for those wishing to contest the proposed maps is closing, paving the way for final approval of the new, more accurate flood zones and associated maps.

The purpose of having this data:

To me, the greatest benefit of having this information is to mitigate risk. In a real-life scenario, I don’t think that Merriam-Webster’s definition works to describe potential areas of risk. Since water moves in precarious ways, we can hope to rely on science and data to give us that clearer picture of areas of risk. This can then be used for landowners to plan new projects or mitigate risk with existing structures. It’s also used by insurance companies—particularly those participating in the National Flood Insurance Program—to assess flood risk and determine insurance requirements. As I understand it, the NFIP is a federal program managed by FEMA that provides flood insurance to property owners, renters, and businesses, and it relies heavily on FEMA’s floodplain maps to assess risk and set insurance rates.

How the data is obtained and displayed:

Again, no expert here, but I do know that the latest information available was provided through LiDAR flyovers to gather contours and terrain, as well as hydrologic and soil studies to model how water moves and flows. Because of the level of technology, these maps can display not only areas of concern but also different levels of risk in certain areas. Historically, my understanding was that the primary defined areas of risk included 100-year and 500-year flood risk areas. I also understand that new efforts are being made to display this risk through percentages as opposed to yearly events, so as not to confuse the intended definition of that risk.

As an example, a property in a 500-year flood risk area does not necessarily mean it will only flood once every 500 years. Describing that same risk as a 0.2% annual chance of flooding conveys the same statistical probability, but in a way that more clearly communicates the level of risk. Similarly, a 100-year flood event area might also be described as having a 1% annual chance of flooding. Because of the advanced technology used to gather this new data, additional flood risk areas can also be defined—but it’s important to remember that these are estimates based on modeling. Obviously, anything can happen.

Who creates the maps?

The maps themselves are generally created through FEMA (Federal Emergency Management Agency) in cooperation with the National Flood Insurance Program (NFIP) and local jurisdictions. FEMA contracts with engineering firms and works with local governments to ensure maps reflect both scientific modeling and local conditions. These are the same maps used for regulating development in flood-prone areas and determining flood insurance requirements.

Can the information be challenged?

As advanced as this data might be, it is broadly used across great areas of landscape. As a result, property owners or developers may have the opportunity to challenge this data through site-specific engineering to determine the exact elevation of a structure relative to the projected floodwaters. This is typically done through an elevation study, which can then be used to produce an Elevation Certificate. While this certificate is often required for determining compliance with building standards or securing flood insurance, it can also be submitted to FEMA to support a request to remove a structure from a mapped high-risk zone.

In some cases, more formal map changes are needed. A Letter of Map Amendment (LOMA) can be requested when a property owner believes their structure or lot was incorrectly included in a flood zone. These are often supported by Elevation Certificates and typically apply to individual lots or structures. For larger-scale changes—such as those affecting an entire development or subdivision—a Letter of Map Revision (LOMR) may be appropriate. These tools can be essential for developers and landowners when building or remodeling near designated floodplains.

What is the County’s role?

In the event that there is development in a floodplain, the County’s policy (as I interpreted during a meeting with the County on the subject) was for structures to be a minimum of one foot above freeboard.

In that meeting, they referred to something called “freeboard,” which, as it turns out, is a nautical term. In boating, freeboard is the distance between the waterline and the edge of the boat—basically the buffer that keeps water from spilling in. In the floodplain world, it’s a similar idea. Freeboard refers to the extra height that structures need to be built above the projected flood level. It gives a bit of wiggle room for things like model inaccuracies or bigger-than-expected storms. In Teton County, that buffer is currently set at one foot above the base flood elevation for any development in a flood zone, though which zone this applies to should be clarified prior to any construction.

Additionally, the representative in the meeting stated that the County does maintain some generic latitude, which might include looking at developable areas on a building site that may not be in the floodplain. There are also considerations when it comes to vegetation removal in instances of development in or around a floodplain, understanding that removing vegetation can also impact these waterways. Because I have not been able to point to any specific area of the code to identify the County’s requirements in addition to those set forth or recommended by FEMA, it is important to remember to consult with industry professionals and engineers, and to work directly with the planning and zoning and/or building departments to understand what’s allowed, and what’s required.

Q1 2025 Residential Market Report & Lookback

April 15, 2025 By Tayson Rockefeller Leave a Comment

It’s been awhile since we’ve given a full comprehensive market report of data over several years, so we felt it was high time, particularly with recent market volatility, stubborn interest rates, and an overall sense of a new market emerging from the craziness post COVID.

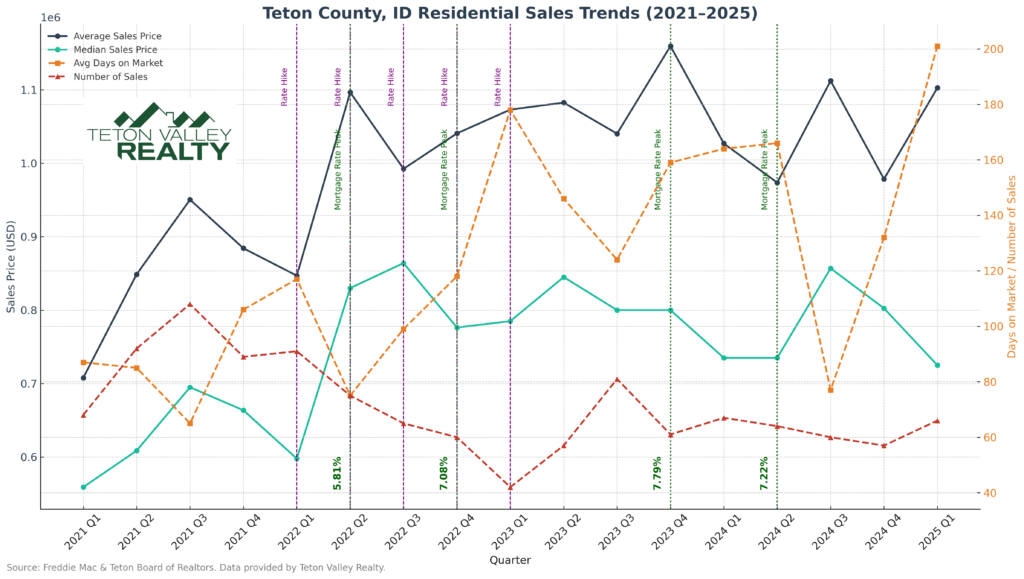
Using data since the first quarter of 2021 through the first quarter of 2025, we put together a graph with all of the data. While it might appear to be a jumble of information, let’s try to break it down.

Rate Hikes

The vast majority of the rate hikes occurred in 2022, so we indicated those with vertical lines. In the first quarter of 2022, we saw the first rate hike since 2018, followed by two rate hikes in Q2 2022, two rate hikes in Q3 and a another rate hike in Q4 of 2022. 2023 and onward witnessed slower hikes and pauses, but most of those were the first two quarters of 2023. The key metrics to watch here include the number of sales which decreased all through those noteworthy rate hikes, and the average days on market which increased mostly through the rate hikes, beginning with the second group of hikes – which makes sense to see this sector of the market lag behind and react to the Federal Reserve’s changes. Following those significant changes, you can see mostly just ups and downs. We’ll summarize that in greater detail below.

Average Sales Prices

The average sales price steadily increased, peaking in or around the 4th quarter of 2023, which seems about right for the market. If you ask most of our Teton Valley Realty Associates, they might agree that the top of the market was actually closer to the end of 2022, but again, it does not seem unusual to see a little bit of a delay here. While the average sales price ended on a high note in the first quarter of 2025, average numbers are easily skewed by large single transactions. A much easier picture to follow is the median sales price, which declined over the past few quarters back after a peak in Q3 2022 (more closely following the team’s sentiment). Similarly, about the time we saw those median sales prices decline, the average days on market again increased, ending at an all time high at the end of the first quarter in 2025.

Median Sales Prices

The median sales price saw its first significant increase, ironically after the rate hikes had begun. This seems to be the most delayed sector of the data from what we can interpret, but there was an area of confusion post COVID where prices (and people) really didn’t know where they were ultimately going to land, seeming to establish themselves with a high point in the third quarter of 2022, which is likely why many of our team Associates felt that was the peak of the market. There was an interesting surge during the third quarter of 2024, possibly due to rate decreases. This aligned with an inversion of the days on market, which sank nearly to a low point during that quarter in 2024.

Number of Sales

This data isn’t too conclusive, other than we saw the inventory bottom out at the end of the most significant rate hikes towards the end of 2023. We aren’t attributing this data to rate hikes, rather inventory diminishing as a result of increasing build costs and a continued strong Seller’s market. This again stabilized in 2023 and beyond, the point at which our team felt we were out of the “COVID era” and into a new market.

Summary, What’s in Store

Obviously, there’s no data to support what we might be in for, though broader market volatility has seemed to have put a short-term damper on sales. However, an interesting (small) bump in the first quarter of 2025 is noteworthy. Looking back through these first quarter milestones on the graph, however, you can see a surge at or around the first quarter of every year. This might be indicative of year end sales coming to a close, or a longer term trend. It’s not unusual for two peak seasons to dictate the greatest number of sales in our market, with the obvious ski season and busy Summer tourist seasons producing contracts, with sales to follow. Overall, we feel that there are a few things working for the real estate market’s continued growth, and a few things working against. Real estate “bulls” might argue that stock market investors might lose confidence and look to real estate for investment opportunities. Additionally, relief for interest rates is likely on the horizon, which could drive more sales. “Bears” would likely look at the overall market’s (stocks, bonds, real estate, etc.) sentiment and volatility trickling down to the real estate market after a long run of significant sales dollars and volume.

📚 Resources & References
📊 Real Estate Sales Data
Teton Valley Realty

Internal data on average and median sales prices, number of residential sales, and average days on market by quarter.

Teton Board of Realtors

MLS statistics for Teton County, Idaho.

💸 Federal Reserve Interest Rate Hikes
Federal Reserve – FOMC Meeting Statements & Historical Decisions
https://www.federalreserve.gov/monetarypolicy.htm

Tracked key interest rate increases during 2022 and early 2023, including:

March 2022: +0.25%

May 2022: +0.50%

June, July, Sept, Nov 2022: Multiple +0.75% hikes

🏦 30-Year Fixed Mortgage Rate Peaks
Freddie Mac – Primary Mortgage Market Survey (PMMS)
https://www.freddiemac.com/pmms

Used to identify weekly mortgage rate peaks. Notable peaks include:

June 23, 2022: 5.81%

Oct. 20 & Nov. 3, 2022: 7.08%

Oct. 19, 2023: 7.79% (highest in over 20 years)

May 2, 2024: 7.22%

📰 News Commentary & Mortgage Rate Analysis
Barron’s, CNBC, Mortgage News Daily

Provided additional commentary on market reactions to rate movements and borrowing impacts.

Election Volatility (2024 Edition)

November 19, 2024 By Tayson Rockefeller Leave a Comment

Back in 2016, I wrote an article about what the election might mean for your real estate. After reviewing some interesting articles and data points, my conclusion was that real estate is much more impacted by market cycles than it is by election cycles. That being said, I did note some short-term volatility leading up to, and shortly after that election. This was true at that time, and here we are once again. In fact, the article was published at about this same time in 2016.

Having been through multiple election cycles over my years in real estate, I know this to be the case, but I was reminded of my 2016 article and talking points after receiving a market trends article written by Jordan Teicher for Zillow. As Brokers, we receive “market insider” information from the real estate giant. Despite my mixed feelings about Zillow, I still participate in advertising and follow their data points, trends and articles.

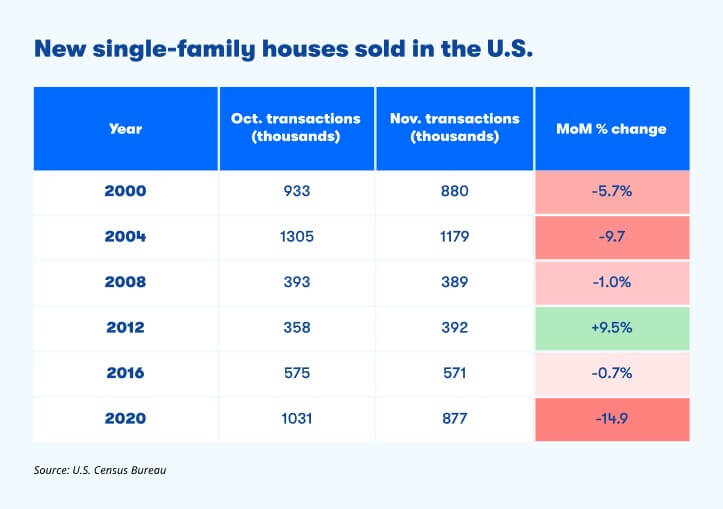
Jordan’s article dissected many common claims about reports of market volatility during election seasons and the claim that people are reluctant to move during these times. He was able to crunch some of the numbers using data from the US Census Bureau which confirmed a typical November slowdown following five of the last six presidential election years. The average month over month change during those six election cycles was -3.7% with only 2012 capturing a positive net change in the November following that election.

He went on to note that comparatively, in years without presidential elections, home sales increased an average of 0.6% between October and November. Over the past 20 years, he notes that transactions actually increased by an average of more than double all other years in December following presidential elections, “suggesting there may have been pent-up demand returning from those who were waiting to see how the election would play out.”

While none of this data may be surprising (it certainly is not to me) it does confirm what we think will continue to happen, a stabilizing market and likely an increase in sales as we move into the Winter peak season here in Teton Valley. As mentioned back in 2016, I believe the market will continue to be shaped by market supply and demand (and interest rates). 2020 threw us for a loop with diminishing supply and overwhelming demand, now with National trends pointing towards continued lack of supply with respect to housing starts. This broad dilemma and the theories behind it are further reinforced by micro factors in our own market including building costs and development challenges associated with growing pains and the continued challenges associated with a new Zoning and Land Development Code throughout Teton County.

Interested in a few associated articles? Don’t forget to check out the following links:

Driving Factors behind Interest Rates (2022)

Teton County Land Development Code

Sources:
– https://www.zillow.com/agent-resources/blog/presidential-election-housing-market/
– U.S. Census Bureau

Teton County Idaho’s FEMA Flood Map Updates

September 22, 2024 By Tayson Rockefeller Leave a Comment

On September 18th, 2024, I attended an open house for a special board with Teton County in conjunction with a FEMA representative for the updated project timeline for new (long-awaited) floodplain maps. Obviously, the information below is my interpretation of that presentation, so always verify information with State, Local and Federal officials.

The purpose of the open house was to review the preliminary floodplain map data released on August 15th. This data was last updated in 1988 with the limited technology at the time. An attempt was made in 2011 to update the mapping with a LIDAR flyover of the county in 2011. However, Teton County GIS coordinator Rob Marin (thanks, Rob) pointed out some deficiencies based on the year and time of year that may have inadvertently resulted in inaccurate and exaggerated flood data. This led to another recent flyover with a greater level of accuracy based on the timing, and newer technology. This new data will lead the way for a 90-day appeal process for those that can provide strong evidence that the new map data is inaccurate. For any objections, it should be noted that a letter of final determination is expected in the Fall of 2025, with final maps taking effect early 2026. The 90 day appeal process is expected to begin in February of 2025 and end in May of 2025. Comments can be provided, and forms are available on site at the Teton County courthouse and online for these appeal processes. This could be something as simple as an incorrect street name, or a more significant appeal such as a formal objection with evidence of inaccuracies. An appeal requires quite a bit of work, and as such, will require some form of significant evidence as to the inaccuracy, usually involving engineering (data based) reports. However, these scenarios will be investigated. These should be provided to Teton County who will pass the comments along to FEMA.

With that out of the way, the meeting was informative as to the new data, how it is mapped, and how it can be beneficial to Teton County. In attendance at the meeting was a representative for FEMA’s Region 10, Marshall Rivers. FEMA’s primary concern is safety, predicting flood risk and preparing for flood events. The last time the flood maps were updated was 1988, and with vast, new technology, FEMA was able to map not only flood information, but ranges of flood risk (as well as a side benefit of 2 foot contour elevations now available from the county). This program for updating the data was in collaboration with local government and the National Flood Insurance Programs (NFIP) in conjunction with FEMA. The federal government is responsible for mapping communities on a continuing basis. The state governments prioritize areas for future mapping studies, and local governments provide local insight and support. They also integrate the data into planning mechanisms and processes.

How are the maps made?

The maps are made using ground survey and LIDAR technology to identify areas of floodplain. The floodplain is generally an area that can be affected by flood or high water. LIDAR is a laser-based aerial tool with extraordinary accuracy that can sense surprisingly small objects. As mentioned above, a byproduct includes two foot contour elevations across almost the entire county. This data can be used by surveyors or land owners for planning and building purposes. There are limitations to these maps which include some uncertainties or uncontrollable circumstances such as log jambs, changing rivers or even land impacted by wildfires. In addition to LIDAR, hydrology and measuring the flow of water is a big consideration in establishing these maps. FEMA worked with Teton County to add study zones with some tasks led by FEMA, and others led by Teton County and other agencies.

Updated Zones and Associated Risks

This new data offers a more granular prediction as to certain areas and their risk levels. Two types of flood hazards were mapped. The moderate flood risk (Yellow, when viewing the map) is intended to show a 0.2% annual chance of flooding (or less impactful areas), and high flood risk which is estimated to be a 1% annual chance of flooding (or more impactful areas). In addition, Floodway (as indicated in these maps in red), indicate areas that could be most impactful, and should be avoided. I was unable to determine the county’s future role in special requirements or restrictions in these areas.

Insurance 

Just because a home is not in one of these identified rest areas, does not mean that there is no risk of flood. Conversely, if your home is removed from these flood areas with the new mapping, it doesn’t necessarily mean that you should cancel your existing flood insurance. According to FEMA, one out of four people who have a claim are not in an area mapped and identified as a high-risk flood area. If your property is added into flood zones in these amended maps, you may be contacted by your lender (and should consider risk insurance, regardless). My understanding is that your flood risk is evaluated by your lender and insurance provider. If homes are built above the base flood elevation of the risk area, this can minimize the added cost, or potentially even the requirement for insurance. You can learn more (and confirm my beliefs) at floodsmart.gov. 

Base Flood Elevation & Development This new data will provide some instant data for what used to require elevation certificates to prove the base flood elevations. Information that may have once required an engineer to evaluate may now be immediately available with the new data. You do need a floodplain development permit whether you are handling infrastructure or building a home, but FEMA does not restrict development in floodplain areas.

OLD DATA (circa 1988)

NEW DATA (as of August 15th, 2024)

  • 1
  • 2
  • 3
  • …
  • 21
  • Next Page »

Recent Testimonials

  • Douglas V.
  • Chuck M.
  • Terry & Joy K.
Teton Valley Realty
Copyright Teton Realty Blog© 2025 - Tayson Rockefeller - [email protected] - 208-709-1333 - sitemap | Privacy Policy, Copyright & Terms of Use