Teton Realty Blog

Teton Region Real Estate Market Stats, Articles & News

  • Home
  • Listings ‘N Stuff
    • Property Search
    • Search Account
  • The Blog
    • Buyers
    • Sellers
    • Local Info
    • Market Reports
    • Know Your Home
    • 2022 Teton County, ID Code
    • Pages & Categories
  • About/Contact Me
    • Contact Me
    • About Me
    • Testimonials
  • Log In/Subscribe
    • Account Set-Up/Log-In
    • Weekly Newsletter
  • Facebook
  • LinkedIn
  • YouTube

Q1 2025 Residential Market Report & Lookback

April 15, 2025 By Tayson Rockefeller Leave a Comment

It’s been awhile since we’ve given a full comprehensive market report of data over several years, so we felt it was high time, particularly with recent market volatility, stubborn interest rates, and an overall sense of a new market emerging from the craziness post COVID.

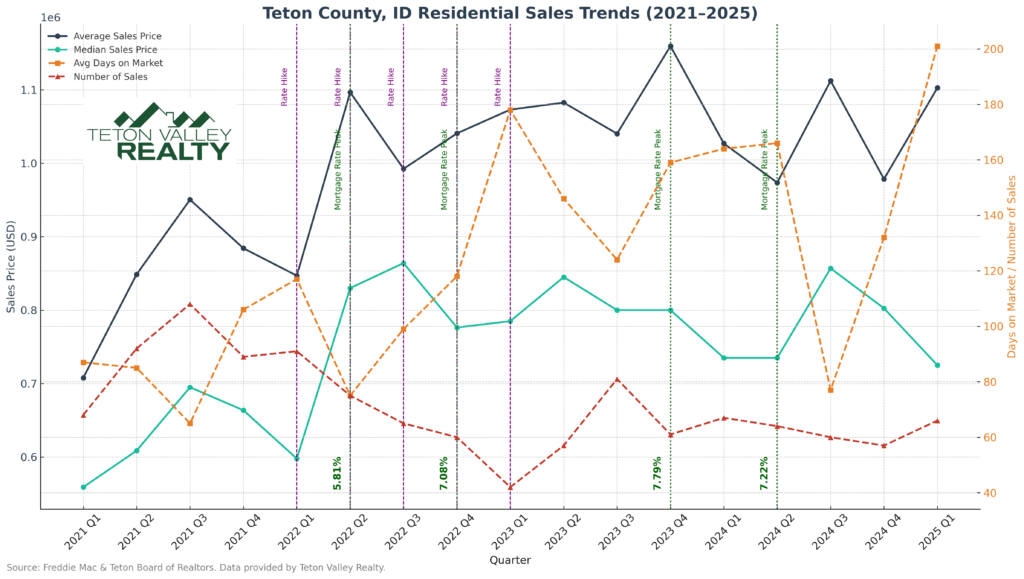
Using data since the first quarter of 2021 through the first quarter of 2025, we put together a graph with all of the data. While it might appear to be a jumble of information, let’s try to break it down.

Rate Hikes

The vast majority of the rate hikes occurred in 2022, so we indicated those with vertical lines. In the first quarter of 2022, we saw the first rate hike since 2018, followed by two rate hikes in Q2 2022, two rate hikes in Q3 and a another rate hike in Q4 of 2022. 2023 and onward witnessed slower hikes and pauses, but most of those were the first two quarters of 2023. The key metrics to watch here include the number of sales which decreased all through those noteworthy rate hikes, and the average days on market which increased mostly through the rate hikes, beginning with the second group of hikes – which makes sense to see this sector of the market lag behind and react to the Federal Reserve’s changes. Following those significant changes, you can see mostly just ups and downs. We’ll summarize that in greater detail below.

Average Sales Prices

The average sales price steadily increased, peaking in or around the 4th quarter of 2023, which seems about right for the market. If you ask most of our Teton Valley Realty Associates, they might agree that the top of the market was actually closer to the end of 2022, but again, it does not seem unusual to see a little bit of a delay here. While the average sales price ended on a high note in the first quarter of 2025, average numbers are easily skewed by large single transactions. A much easier picture to follow is the median sales price, which declined over the past few quarters back after a peak in Q3 2022 (more closely following the team’s sentiment). Similarly, about the time we saw those median sales prices decline, the average days on market again increased, ending at an all time high at the end of the first quarter in 2025.

Median Sales Prices

The median sales price saw its first significant increase, ironically after the rate hikes had begun. This seems to be the most delayed sector of the data from what we can interpret, but there was an area of confusion post COVID where prices (and people) really didn’t know where they were ultimately going to land, seeming to establish themselves with a high point in the third quarter of 2022, which is likely why many of our team Associates felt that was the peak of the market. There was an interesting surge during the third quarter of 2024, possibly due to rate decreases. This aligned with an inversion of the days on market, which sank nearly to a low point during that quarter in 2024.

Number of Sales

This data isn’t too conclusive, other than we saw the inventory bottom out at the end of the most significant rate hikes towards the end of 2023. We aren’t attributing this data to rate hikes, rather inventory diminishing as a result of increasing build costs and a continued strong Seller’s market. This again stabilized in 2023 and beyond, the point at which our team felt we were out of the “COVID era” and into a new market.

Summary, What’s in Store

Obviously, there’s no data to support what we might be in for, though broader market volatility has seemed to have put a short-term damper on sales. However, an interesting (small) bump in the first quarter of 2025 is noteworthy. Looking back through these first quarter milestones on the graph, however, you can see a surge at or around the first quarter of every year. This might be indicative of year end sales coming to a close, or a longer term trend. It’s not unusual for two peak seasons to dictate the greatest number of sales in our market, with the obvious ski season and busy Summer tourist seasons producing contracts, with sales to follow. Overall, we feel that there are a few things working for the real estate market’s continued growth, and a few things working against. Real estate “bulls” might argue that stock market investors might lose confidence and look to real estate for investment opportunities. Additionally, relief for interest rates is likely on the horizon, which could drive more sales. “Bears” would likely look at the overall market’s (stocks, bonds, real estate, etc.) sentiment and volatility trickling down to the real estate market after a long run of significant sales dollars and volume.

📚 Resources & References
📊 Real Estate Sales Data
Teton Valley Realty

Internal data on average and median sales prices, number of residential sales, and average days on market by quarter.

Teton Board of Realtors

MLS statistics for Teton County, Idaho.

💸 Federal Reserve Interest Rate Hikes
Federal Reserve – FOMC Meeting Statements & Historical Decisions
https://www.federalreserve.gov/monetarypolicy.htm

Tracked key interest rate increases during 2022 and early 2023, including:

March 2022: +0.25%

May 2022: +0.50%

June, July, Sept, Nov 2022: Multiple +0.75% hikes

🏦 30-Year Fixed Mortgage Rate Peaks
Freddie Mac – Primary Mortgage Market Survey (PMMS)
https://www.freddiemac.com/pmms

Used to identify weekly mortgage rate peaks. Notable peaks include:

June 23, 2022: 5.81%

Oct. 20 & Nov. 3, 2022: 7.08%

Oct. 19, 2023: 7.79% (highest in over 20 years)

May 2, 2024: 7.22%

📰 News Commentary & Mortgage Rate Analysis
Barron’s, CNBC, Mortgage News Daily

Provided additional commentary on market reactions to rate movements and borrowing impacts.

Summer 2024 Market Update

July 13, 2024 By Tayson Rockefeller Leave a Comment

Since this is technically a blog article and my market updates live in a separate section over at TetonValleyRealty.com, I’m going to treat this market update more like a blog post, just to convey my general feelings and sentiment of the market.

Residential

The residential sector of the market in Teton Valley and surrounding counties (Teton County, Wyoming and Lincoln County, Wyoming) all share similar attributes and challenges, though at different price points.

Dare I call any sector of the residential market “starter homes” (considering the average residential sales price in the Teton regional MLS is well over a million bucks) this sector of the market seems to be accumulating the most days on market and is faced with the greatest challenges. Why? Back to that average sales price. While the average sales price in communities like Teton Valley and Alpine are under 1m, they are still big numbers. Combined with interest rates which remain stubbornly high, we are beginning to see Summer price reductions. In other words, residential listings priced under 1.2m in the bedroom communities or maybe 2m in the Jackson area (which generally excludes the luxury/second home market), are faced with the most difficult sector of the market today. Despite this seemingly grim data for Sellers, inventory is still extremely limited, and opportunities that fit the bill for most consumers are still few and far between.

The luxury market in all sectors (once again, at different price points depending on the micro market) seems to still be churning along, if impacted by nothing other than increasing inventory, primarily due to more builders jumping into the game, or at least focusing on projects of this caliber. Many similar models I have sold for builders have crept up ever so slightly in terms of price, but the market seems to be fairly stable. Summer inventory does seem to be further increasing, which could have a slight impact as the market stabilizes from the short-term yet jarring effects of the Teton pass closing, and the speculation of long-term closure, now behind us. 

Condos and townhouses are certainly plentiful, but inventory is slowly being absorbed. While I felt we were at a high point in terms of supply towards the end of last year and into the Spring, it does seem that that market is stabilizing. 

Predictions; to summarize, it’s obviously still difficult to see where the general economy takes us with inflation seeming to cool but interest rates remaining stubborn. For those that have been waiting to jump in, the message from many of the lenders in the marketplace has been to jump in now while Sellers in the “starter home” price point are vulnerable, taking advantage of lower interest rates when a refinance is realistic. That sentiment may have been a little premature a year ago, but it does seem that inflation is cooling and rates are likely to soon decrease. The “covid craze” seems to be subsiding, and some sellers appear to be faced with, and accepting reality in that regard. I know that many Buyers are waiting for a correction, but from my perspective, I hear fewer that believe this is soon to happen than those that think it won’t happen anytime soon.

Land

I have long said that the land market seemed to have stabilized towards the end of 2021, with the tremendous gains capped by new inventory and market stabilization. I still see small spikes and valleys in those trends in specific areas, the Teton view corridor is a good example. Ample supply (though unusual in these areas) can reduce overall prices, while limited availability can have the opposite effect, but in an even more dramatic way. Other parcels with some form of unusual feature can also benefit from limited supply, such as industrial zoned land, land without covenants and restrictions, land with interesting terrain, water features, trees or otherwise have all seen greater increases. Some areas, however, have seen greater instances of stabilization or even a slowdown, particularly those that lack any unique aspects or reside in communities with strict guidelines that require more expensive builds. 

Construction

As an aside and in line with the last sentence above, construction costs have remained surprisingly resilient to cooling and inflation. While some materials have reduced in cost, others have increased. Subcontractors are showing no signs of slowing down in terms of cost increases, which tells me that there is still plenty of work on the horizon. Many local governments have been inundated with new custom and speculative bills and just like the huge cost increases in terms of construction costs keeping new projects at bay, the difficulty in obtaining building permits, combined with stubborn construction costs has kept new inventory from exploding. It’s frustrating for builders and investors, but it’s probably keeping the market under control at the same time.

Rental Analysis – How do I understand Rates and Projections?

November 11, 2023 By Tayson Rockefeller Leave a Comment

There is a lot to unpack here, and it’s important to know that rental markets change extremely quickly in the scheme of things. While COVID played a significant role in the short-term rental industry and our market locally, the long-term rental industry has been evolving at a fast pace as well. I’ve made some market predictions about both industries over the years and despite the outcome one thing is for sure, you don’t necessarily rely on what you hear today, because it’s inevitably (almost) always yesterday’s news.

Valuation
When it comes to valuing real estate, real estate agents (not appraisers and not offering appraisals) and appraisers use similar methods which include different types of valuation. The easiest, and most common is the comparable sale method. We essentially adjust the sales price of comparable properties based on differences between the property we are valuing and the property that has actually sold. Obviously markets change, so we generally don’t look back further than 6 or 12 months. The sales information is normally available mostly as a courtesy of the multiple listing service, a database of sales activity stored by local Realtor associations. Since Idaho is a non-disclosure state, counties often find difficulty valuing property for the purpose of tax assessment, so the public data is often skewed.

Depending on the area, rental data may be collected by a multiple listing service. However, in our area, it is not. The reason for this is based on several factors, but in my opinion it is primarily because Idaho does not require licensure for property managers. For this reason, property managers in the Teton Valley area are generally not members of listing services or Realtor associations, so they do not record the data. Even in Wyoming where property management does require a real estate license, much of the data goes unrecorded. So, how is the data tracked? Depending on whether we are talking about short-term or long-term rentals, there is some data that might be available, but often, you need to take it with a grain of salt.

Short-Term Rental Analysis
Much like the Zillow “Zestimate”, there are “data mining” companies and tools available that can help generate valuations even without multiple listing service data. Because Idaho is a non-disclosure state, Zillow does not have access to sales data. They do, however, have access to listing price data. Presumably when a property sells (even though Zillow may not have access to the actual sales price), they can make some assumptions based on market conditions, how long the property was on market before it sold and other metrics to estimate (or zestimate…) the sales price to help generate the “Zestimate”. There are similar tools available in the short-term rental industry available such as AirDNA and other data providers that are able to collect data. While I’m not an expert on AirDNA, my assumption is that they collect data from their own subscribers that report information, as well as data they receive from some of the marketplace giants like Airbnb and VRBO. I also assume that this data may be skewed based on what they receive. If it’s just a blocked calendar, one probably should not assume that it is necessarily a paying guest since it could certainly be a homeowner blocking their own calendar for personal use. Even though this data may in some instances be conservative, this is my best guess as to why we often find AirDNA provides data that may be unattainable in the real world (here in Teton Valley).

Long-Term rental analysis
This one is even more challenging. Not only are property managers not typically a member of the multiple listing service, but they rarely collaborate. This, coupled with the seasonality of long-term rentals (and short-term rentals, for that matter), can create some volatile expectations for both investors and tenants. Many years ago before the market hardly began to improve after the fallout in 2008, I distinctly recall many conversations with those trying to prepare studies and gathering data in order to do so. Similar to my life today, I was completely underwater trying to provide this data as a courtesy, often off the top of my head. While I’m generally pretty good at doing so, and can spit out fairly accurate information, it’s unlikely that any of the data was extremely scientific when it came to absorption, rates, and so on. While short-term rentals at least have some available information that might point to market conditions such as National software providers like Airbnb or VRBO, the local rental market does not. As a result, long-term tenants often find themselves jumping from property manager to manager and newspaper ad to marketplace listing to get a grasp on inventory, or lack thereof. I will give a shout out and link below a great effort set forth by the Community Resource Center of Teton Valley. They (painstakingly I’m sure) canvas the most well-known sources for long-term rental listings throughout the community and compile them into one list. It’s not perfect, and not up to date to the minute, but it’s pretty darn good.

The bottom line? When it comes to understanding rental markets in Teton Valley, trust your local professionals. While Realtors have a pretty good handle on most things around here (really, the local industry is lucky to have such a hardworking, professional and honest group) not all of them are heavily involved with property management. The best advice that I can give is to trust local property management companies. Similar to our group of real estate professionals in the area, all of the property managers in Teton Valley are extremely well versed and honest. Since I’m listing shout-outs (and yes, I do have an interest at stake here), Kerstyn at Teton Valley Property Management is amongst the very best.

Community Resource Center of Teton Valley

Teton Valley Property Management

My Property Isn’t Selling, What Should I Do?

October 13, 2023 By Tayson Rockefeller Leave a Comment

It’s funny how quickly markets change. Just yesterday (as I write this in October of 2023), properties were selling so quickly that buyers were all but waving inspections to get their foot in the door. I am also reminded of the changing landscape of the rental market, though I won’t rub it in with the “I told you so” comments for now. Regardless, and interestingly, prices haven’t budged much. This is mostly a product of supply and demand, but it’s also a different topic.

Speaking of prices, let’s get back to the issue at hand. Many property owners and Sellers haven’t adjusted to the market conditions today. Things are taking more time to sell. There is actually a way to calculate how long something should take to sell, and I have written several past articles relating to absorption. In addition, prices have adjusted. In some sectors of the market the prices have continued to rise, but most have stabilized, if not fallen as a result of affordability issues related to increasing interest rates. If you’re asking the subject question and you haven’t been educated on the average amount of time it takes to sell a property (or realistic valuations), then the answer is probably simple. Ideally, we set expectations before listing a property and take a realistic data based approach to valuation and where to begin marketing in terms of a listing price. The mentality of “we can always come down” can be more damaging to the prospect of selling a property than one might think.

This article, however, is aimed more at those considering not “what should I have done”, but “what should I do now”?

First; I would suggest evaluating absorption to make sure that you don’t have an unreasonable expectation. If the market data suggests that it’s going to take 6 months to sell a property, and you’re asking this question 3 months after listing, patience may be the answer.

Second; let’s take a look at pricing. If you made a decision to list at a higher number with the mentality that you can always reduce the price, it may be time to do just that. This being said, you may need to reduce more than you otherwise would have needed to. I would suggest taking a look at the original valuation, as well as market conditions that may have changed. Are we now outside of peak months? *Yes, I have an article on this as well* Have the interest rates now changed market conditions? The bottom line is that market absorption calculations only work with properties that are listed at actual market values. If you are provided with data that suggests that there is 6 months’ worth of inventory and a suggested listing price of $850,000, yet choose to list the property for $975,000, you can bet you are going to be outside of the absorption window. Additionally, those that provide this data, whether it’s an appraiser or a real estate agent, can’t control the market and they don’t always hit the nail on the head. It’s important to have follow-up discussions and plan your next move ahead of time.

Finally; let’s talk about seasonality. We talked about the seasons and how they can impact marketing time, but the seasons also come with… seasons. If you listed a property in July, and you’re making adjustments in December, it might be time to discuss updating the photography to something that doesn’t scream: “I have been on the market for 7 months!” This is usually most important in reverse, Winter photos should always be updated in the when things green up in the Spring or early Summer months.

  • 1
  • 2
  • 3
  • …
  • 18
  • Next Page »

Recent Testimonials

  • Douglas V.
  • Chuck M.
  • Terry & Joy K.
Teton Valley Realty
Copyright Teton Realty Blog© 2025 - Tayson Rockefeller - [email protected] - 208-709-1333 - sitemap | Privacy Policy, Copyright & Terms of Use