Now that we have a 30,000-foot look at the Teton County, Idaho and Alta, Wyoming numbers, what do they mean?
For those that read our reports, you know I like to break things down in a way that can actually be digested… at least that’s the intent. We all know I tend to get a little bogged down in the weeds.
2024 vs 2025: Total Market
At first glance, 2024 and 2025 are as close as it gets.
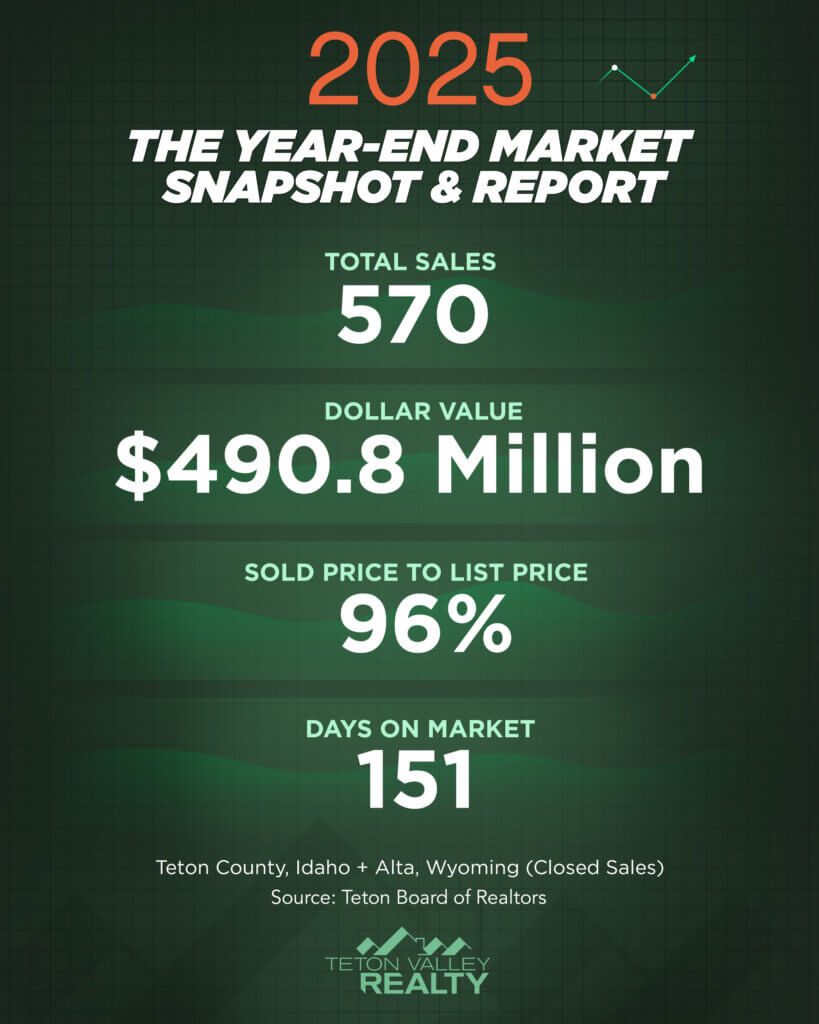
- Total sales: 2024 had 559 sales. 2025 recorded 570.
- Average days on market: 146 in 2024 vs 151 in 2025.
- Sold-to-original list ratio: 93.98% in 2024 vs 93.89% in 2025. (I did a double take too.)
- Median sales price: $425,000 in 2024 vs $559,000 in 2025.
That last number is the one that makes you lean in, so let’s split the market into land vs homes to see what’s really driving the difference.
Land
When I pulled land stats side by side, it immediately looked like land wasn’t the source of any major discrepancy. Most metrics are within about 10% and a few are almost identical.
For reference, in 2025:
- Average sales price: $388,530
- Median sales price: $245,000
Days on market and sold-to-list ratios are also very close year-over-year, which supports the idea that the “story” of the median jump isn’t really coming from land.
Homes
The residential is where you start to see movement:
- Average residential sales price:
- 2024: $1,040,952
- 2025: $1,220,715
- Median residential sales price:
- 2024: $776,000
- 2025: $890,000
At that level, it also puts the median price per square foot around $474, which sounds crazy to people who aren’t used to Rocky Mountain build costs. But remember, that price includes the land.
So the obvious question becomes: is this a true “across the board” increase, or is it being skewed by a heavier luxury year?
Luxury Sales ’25 vs ’24
This is where 2025 starts to separate itself:
- 2024:
- 6 undisclosed sales
- 18 sales over $3,000,000
- High watermark: $5,100,000 on the Idaho side
- Wyoming high: $2,850,000
- 2025:
- 17 undisclosed sales
- 18 sales over $3,000,000
- Peak: $7,750,000 (highest recorded in Alta)
- Followed by $6,100,000 on the Idaho side
Here’s the interesting part: those $3M+ sales still closed at nearly 97% sold-to-list in 2025. That’s a pretty strong nod toward how much the luxury segment influenced the overall 2025 averages.
The “Greater Market” Band (A Better Read on Normal Conditions)
To get a clearer picture of the everyday market and avoid the distortion from:
- condos under ~$500K (often selling near ask), and
- the established luxury tier (also often selling near ask as established above),
I looked at a band from $750,000 to $2,250,000. This tends to be the sweet spot where negotiation, pricing strategy, and buyer sensitivity starts to show up.
In this range:
- Sold-to-list ratio: under 96%
- Sold-to-original list ratio: closer to 92% (more telling)
And when you track the median in this band over time:
- 2023: $750K–$2.25M median: $1,090,000
- 2024: $750K–$2.25M median: $1,099,000
- 2025: $750K–$2.25M median: $1,095,000
That’s basically flat.
So… are prices down?
A lot of my customers are asking if prices are down. If I’m being honest, it feels like they are. But when I look at the numbers, I have a hard time finding the smoking gun.
I think the answer is this:
We’ve all gotten used to prices rising. Build costs have most certainly increased (even though they aren’t directly represented here). And with median prices in that “core” band staying relatively flat, it’s more evident that listing prices are still inching up, but negotiations are pulling sales prices back down into the same range we’ve been living in for a few years now.
In other words: it’s not a dramatic price drop, it’s a market where pricing optimism meets reality at the negotiating table.