While I don’t always admit it, PART of my motivation for writing these articles is to provide a resource that is available 24/7, so I don’t have to be. In addition, articulating the information in this video when selling my services (yes, I do property management – albeit indirectly – as well) feels awkward. In any event, Teton Valley is seeing a number of property management firms popping up, and they all do a great job. However, some of them sell their services on a much lower fee, whether or not that is a tactic for business or not. This video is not directed at specific firms, but should help level the playing field when considering your options. Enjoy!
NEW ZONING AND LAND DEVELOPMENT CODE | PART I, ZONING OVERVIEW (TETON COUNTY, ID)
For those of you that take the time to read my blog (thank you) you know that I try to make the information relevant to the region. I will begin trickling blog posts in with information on the new zoning and land development code impacting the unincorporated areas passed July 6th, 2022. I will include a “2022 Teton County, ID Code” blog category which you can find in “THE BLOG” section, above. I am going to begin with an overview of the zoning changes which I felt I could better explain in a video, below. Enjoy, and stay tuned for articles to follow breaking down the 2022 Land Development Code for Teton County, Idaho.
The Board of County Commissioners adopted a new Land Development Code on Wednesday, July 6, 2022. It will become effective on August 3, 2022, after it has been noticed in the local newspaper for two weeks. Note: New City Area of Impact (AOI) zoning will soon be renegotiated between city and County governments. Victor and Tetonia AOIs remain as County 2.5-acre minimum lot size in the meantime. The Driggs AOI retains its own unique zoning scheme until the zoning is renegotiated.
TETON COUNTY, IDAHO ZONING ANNOUNCEMENT
TETON COUNTY, IDAHO LAND DEVELOPMENT CODE ANNOUNCEMENT
New Land Development Code in Effect August 3rd, 2022Land Development Code*All complete applications submitted by August 2nd, 2022 will be reviewed under Title 8 and Title 9 current regulations*
Frequently Asked Questions:
Can the new county code be adopted by the voters of Teton County, Idaho?
Zoning ordinances are not able to be adopted by initiative. I.C. §34-1801B(22) states that the broadly constructed individual right to petition via initiative and referendum simply, “does not apply to any local zoning legislation including, but not limited to, ordinances required or authorized pursuant to chapter 65, title 67. This was established in 2018 with the passage of House Bill No. 568 which amended the states initiative and referendum procedures to prohibit voter approval of local zoning legislation or any actions authorized by LLUPA. This includes comprehensive plans, zoning ordinances, subdivision ordinances, variances, and conditional use permits.
“When will the new Code take effect?”
The new Teton County Land Development Code will take effect when adopted by the Board of County Commissioners. This is expected to occur in 2022 after the final public hearing and review.
“Does this Code change development standards for the entire valley?”
It does not.
Teton County contains seven different land planning jurisdictions—the three cities of Victor, Driggs and Tetonia, the three doughnut-shaped areas of impact (AOI’s) that surround each city, and the unincorporated county beyond the AOI’s. The new Teton County Land Development Code will only govern development in the seventh jurisdiction—the unincorporated rural parts of the county outside of the cities’ areas of impact.
The cities of Driggs, Tetonia and Victor will remain as high-density areas of development under their respective individual development ordinances. The three areas of impact surrounding each city will remain under the control of individual AOI agreements negotiated between each city and the county. They are intended to contain transitional zoning with densities that are lower than the cities but higher than the rural county.
“Will the Code make existing landowners comply with new standards?” Existing buildings and development will not be affected by the new draft Code. They will be allowed to continue as “nonconforming uses.” Existing lots that don’t comply with new density assignments will be allowed to be developed per their original entitlements. The new LDC only regulates new land division proposals and establishes minimal regulation of short-term rentals.
Nonconforming structures: If structures become non-conforming, it only means they are not up to code. Most old structures of any age fall into this category each year, as the International Building Code gets updated every three years or a land development code gets changed over time.
Teton County Land Development Code Update | Executive Summary of Changes 4
With any new Land Development Code that gets adopted, it applies only to new construction projects and new developments. What is already built, subdivided and existing now is not affected by new density requirements, fencing requirements, height limits or view corridor requirements. No one will ever be asked to tear down or replace existing structures by a governing body.
“I heard the Scenic View Corridor set back was 1000 feet!”
Regarding scenic view corridors, the set back is not 1000 feet along the highway. The initial sentence in the draft pertains to the definition of a view. The draft ordinance originates from state law.
The LDC draft has two types of scenic corridor protections: type 1 and type 2. Both have design review provisions for development that occurs within 500 feet. There are options for new applicants within that 500’ distance for graduated increases in height limits as the home location steps back from the right of way.
“How will the new Code affect my home business?”
Small home businesses in residential zones have become less restricted in the draft LDC. What was a four page section of restrictions in the old code, is now just one page. A business sign is now allowed with a permit for starters.
The restrictions, for example, on deliveries of ten per day, sets a limit of what neighbors could be impacted by from small businesses in their residential zone. The use standards for home business are listed in 3-9- 6 of the proposed LDC.
Any home business with traffic and high levels of activity in one form or another that has outgrown a home business may be classed as light home industrial. If at any point the home business or home industry exceeds the standards for a residential zone, it needs to relocate to a commercially zoned parcel.
“How will the new Code affect my short-term rental?”
Because of the rapid unregulated spread of short-term rentals throughout the county, and since Idaho Statute allows for a county or city to implement “reasonable regulations….to safeguard the public health, safety and general welfare,” the new Teton County code does establish standards for parking, limits the ensures that the allowed numbers of occupants are appropriate for the septic size, establishes quiet hours, and sets other basic civil standards. The new draft Code additionally establishes requirements for trash storage, smoke detectors, etc.
Short-term rentals will be required to obtain a Short-Term Rental Registration (Permit) with the Planning Department to verify that use standards have been met prior to the use being approved. A building inspection may be performed prior to permit issuance. A permit will identify the owner of the property and their contact information. Property management contact information, if applicable, will also be listed.
The permit requires notification of the neighbors in each direction that may be impacted by the new rental activity. Having proof of emails or letters that notify neighbors 30 days prior to the start of rental activity is the new requirement in the LDC.
Property owners and managers that follow these guidelines will reduce the number of problems for neighborhoods throughout the valley.
Teton County Land Development Code Update | Executive Summary of Changes 5
“Why change the zoning districts?”
Teton County’s existing Zoning Map identifies basically two zone densities in the unincorporated parts of the valley—A-20 and A/R-2.5. These zones were established in the early 1990’s, were largely self-assigned by property owners, were not based on a comprehensive plan, and only vaguely reflect the valley’s actual land use patterns and landforms. In contrast, the Comprehensive Plan’s Framework Map identifies six zones which have been delineated according to actual topography and existing settlement patterns. These include Rural Agriculture, Rural Neighborhood, Foothills, Mixed Ag/Rural Neighborhood, Mixed Ag/Wetland, and Industrial/Research.
“Why change density assignments?”
The Comprehensive Plan calls for changes in how lands may be divided in each zone, including revised densities. In response, the Steering Committee, the Planning and Zoning Commissioners, and the Board of County Commissioners have worked out a new set of densities to better reflect the needs of the Coutny and the Comprehensive Plan: Rural Agriculture- 35-acre, Mixed Ag/Wetland-35-acre, Mixed Ag/Rural Neighborhood-20 acre, Foothills-10-acre, Foothills- 20-acre, Rural Neighborhood-7.5 acre, and Industrial/Research.
Update: In subsequent editing by the P&Z Commission, Rural Agriculture zoning was revised to 35-acre zoning and Mixed Ag/Rural Neighborhood was revised to 7.5-acre zoning.
The current valley-wide basic densities of 2.5 acres and 20 acres offer little choice and are relatively small in size for a rural community. 20-acre zoning is simply too small for most agricultural purposes and does little to protect meaningful open space. Other comparable mountain communities around the Rockies offer both a wider range of assigned densities, and far lower density limits (with corresponding higher acreage numbers).
“Why switch to average density zoning?”
For the most part, the LDC Steering Committee proposed to get rid of minimum lot size requirements in favor of using average density as the guiding principle in how many lots can be created in a subdivision (a 1-acre minimum lot size is planned to remain in all zones to accommodate fundamental well-septic separation requirements). By definition, this would allow clustering by right. This change represents a major shift in land development policy for the county. It is absolutely intended to help families get the additional lots they desire and keep quality farmland and families together. It is a win for everyone.
Average density zoning provides greater flexibility for property owners and developers, while allowing the community to reach many of its most important goals from the Comp Plan. An enormous advantage of average density zoning is that rather than having all the land in the parcel incorporated into lots, any land leftover could either be put into a conservation easement, deeded to a homeowners’ association, left as a working farm or otherwise utilized in a similar manner.
“Can I split off a small piece of land to give/sell to one of my family members? How?” Two methods are available to larger landowners to achieve this goal. The first is to simply utilize the average density zoning method just described in the previous answer. The second is to utilize a short plat land division to divide acreage into up to four parcels.
Teton County Land Development Code Update | Executive Summary of Changes 6
“How does the new Code help protect wildlife and natural resources as highlighted in the Comp Plan?”
All development proposed within wildlife habitat as identified on the Teton County Natural Resource Overlay Map will be subject to Site Plan review to ensure that the location of proposed development or use avoids or mitigates impacts to indicator species and indicator habitats to the extent practical. The location of proposed development will reduce fragmentation of habitat, avoid locations that affect landscape elements such as unique rock formations, sheltered draws, drainage ways, or other features, maintain connectivity among habitats, and protect sensitive fish and wildlife breeding areas and winter ranges.
If impacts cannot be avoided, the lost habitat will be required to be mitigated by replacing it with similar vegetation communities at a one to one (1:1) ratio. The replacement ratio must be higher within a half mile of riparian areas and equal a two-to-one (2:1) ratio. Perimeter fencing will need to be wildlife friendly—this requirement does not apply to privacy fencing used to enclose the living space immediately adjacent to a Dwelling Unit.
If a subdivision proposal falls within the natural resource overlays, the Administrator, Planning Commissioners or BoCC may ask for a more detailed Natural Resource Analysis.
“How is the Code different from the Comprehensive Plan?”
Both a Comprehensive Plan and a Land Development Code are required by state statutes contained in Idaho’s Local Land Use Planning Act. The Comprehensive Plan is a conceptual document outlining the community’s vision and goals. In Teton County’s case, our Comprehensive Plan was adopted by a BoCC resolution in 2012. The Code is then supposed to be built from the Comprehensive Plan’s outline into a working set of ordinances.
Financing Options, Let’s Get Creative!
Usual disclaimer: I am not a lender. Always verify information and available programs with your lender. I recently wrote an article similar to this one, but I’m going to try to use this article just to get down to brass tacks on financing options and ways to get creative to get the best rate, and to lock that rate in the event you are purchasing new construction and are in a holding pattern.
Rate Locks & Extended Rate Locks
Many people don’t realize that you can lock rates for an extended period of time. This is an excellent tool when purchasing real estate that is under construction. Lenders usually carry products to lock rates for 6, 9 or even 12 months. While these products may come with a slightly higher rate, they often have options to “float down” the rate in the event rates begin to decrease. This is the best of both worlds.
Temporary Buy Downs
Temporary buy Downs can be a great way to secure a loan for someone that might be pushing their limits in terms of a debt to income ratio, and need to get their payment a little lower for the first couple of years. This buy down can sometimes be negotiated with the seller to be paid at closing, and provides the buyer with a payment that is a little more manageable for the first two or three years.
Permanent Buy Downs
Nothing new with buying your interest rate down up front, but it is important to look at the payback depending on how long you intend to hold the loan. Typically a buying “point” (1% of the purchase price amount) will get you a 1/8% to 1/4% lower rate, but it’s always great to get a quote because sometimes a point can get you an even greater discount.
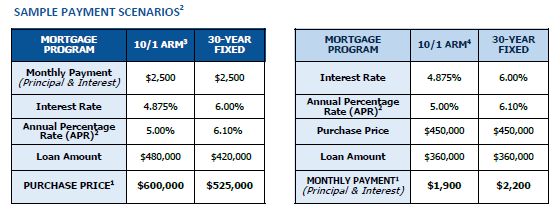
Adjustable Rate Mortgages An adjustable rate mortgage can be a scary thought, basically it’s fixed for a certain amount of time and can adjust up after the initial fixed rate period expires. However, below is an example of a comparison between a 10-1 adjustable rate mortgage and a 30-Yr fixed mortgage, roughly it today’s rates. Considering the average homeowner holds their mortgage or loan far less than 10 years, there’s quite a bit of protection as well as opportunity to refinance that loan during a decade long time span.
Interest Rates, Ideas for Buyers and Market Impacts
It’s no secret, interest rates are definitely on the rise, and likely will continue to do so. It’s interesting hearing about all of the potential impacts. A lender friend of mine provided some good insight recently. Interest rates are still very low from a historical standpoint, and there are still some great ways to minimize the impacts of rising rates. These include mortgage points that come with a variety of options and the ability to have these points negotiated into a transaction or even paid by the seller. A mortgage point is effectively a way to buy down the interest rate up front. This can be a great tool to help buyers keep up with today’s real estate prices, which don’t seem to be going down despite interest rates creeping up. Buying mortgage points can also work well for buyers that intend to keep their loans long-term. Typically a “point” is equivalent to 1% of the purchase price and that will usually reduce the interest rate anywhere from 1/8 to 3/8 of a percent. Other options include a 2-1 (or even a 3-2-1) buy down which reduces the first year by 2 points in the second year by one point, which is where the highest amount of interest is paid on a loan while the principal of balance is still high.
Obviously interest increases are coming as a way to combat inflation, and it’s probably the lesser of two evils. Interestingly, supply chain issues, high building costs and other factors on the supply side are keeping new inventory at bay. Whereas real estate is primarily supply and demand based, this has created an interesting dynamic for both buyers and sellers. Personally, I do believe that the cumulative total of these issues will have an impact on the market, but without the increase of supply, I’m interested to see how much (if any, I should add).