Teton Realty Blog

Teton Region Real Estate Market Stats, Articles & News

  • Home
  • Listings ‘N Stuff
    • Property Search
    • Search Account
  • The Blog
    • Buyers
    • Sellers
    • Local Info
    • Market Reports
    • Know Your Home
    • 2022 Teton County, ID Code
    • Pages & Categories
  • About/Contact Me
    • Contact Me
    • About Me
    • Testimonials
  • Log In/Subscribe
    • Account Set-Up/Log-In
    • Weekly Newsletter
  • Facebook
  • LinkedIn
  • YouTube

2021 Land Year End Sales Report

December 19, 2021 By Tayson Rockefeller Leave a Comment

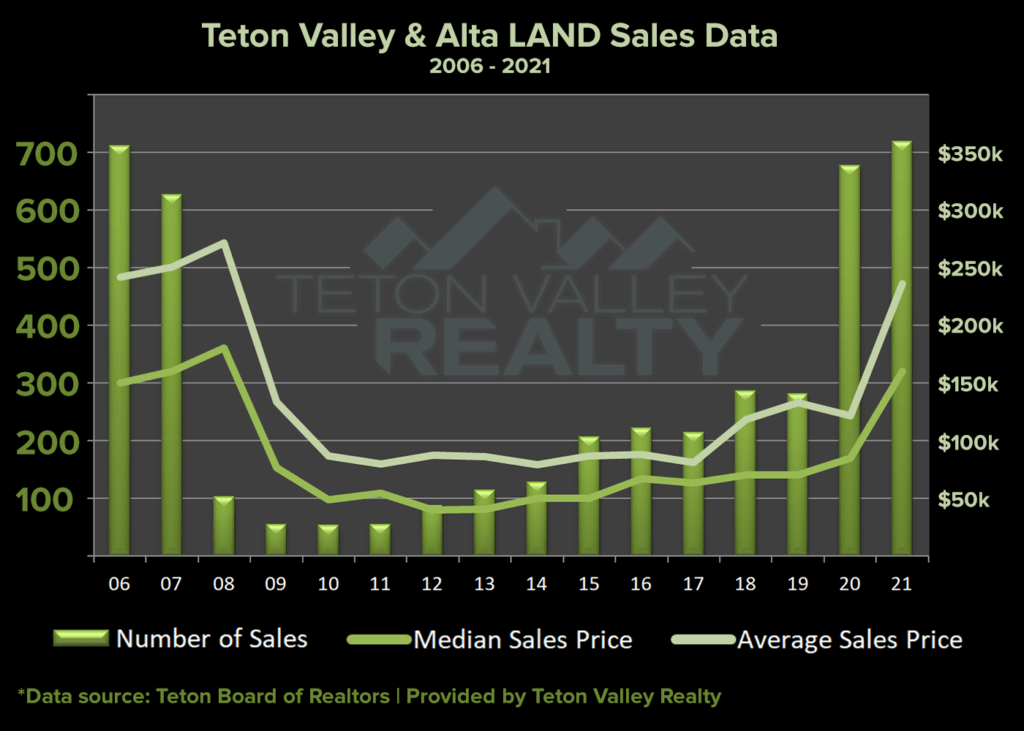
It’s that time of year again and it’s always fun to see the data. A friend suggested I prepare this in a graph style format. Naturally, I researched data from 2006 to date. For those of you reading the article as opposed to my blog or newsletter, you can probably already picture the trajectory of that graph from a high point in 2007, a low point in 2009, stagnation from 2010 to 2014, slow but increasing improvement to 2019, followed by a sharp increase in 2020. Here are my takeaways;

2008: There were 102 sales in 2008 compared to only 55 sales in 2009. Interestingly, things fell off later in the year, seeming to lag behind the rest of the Nation’s real estate trends.

2009-2012: The official recession had long been over by 2012, though land hadn’t seen much improvement in terms of the number of sales or the average sales prices during this time. These are the years with opportunities we likely won’t ever see again. I don’t attribute all of 2020’s massive gains to the usual pandemic related craze, I have always believed that land was too cheap for too long in the area.

2013-2018: This was the slow recovery stage I mentioned. It’s almost silly to think that any portion of the real estate market was still recovering this long after economic decline, but still, land prices were far cheaper than large tract land acquisition and development costs. As a result, inventory dwindled despite a huge oversupply that was attributed to the long-lasting “bargain” period.

Q1 2019 vs Q1 2020: In order to get a bit more quantifiable data I actually ran this report December 1st through March 1st (I didn’t want the pandemic in March of ’20 to impact this observation) and found that 2019 saw 37 sales with an average sales price of $188,896. One sale during that time at $3m had a big impact on that average, the median sales price was $72,000. 2020 saw 52 sales with an average of $73,064 and a median sales price of $59,000. I found it interesting that the number of sales for that quarter increased in 2020 but the median sales price decreased. For those of you looking at the graph and seeing the average sales price dip in 2020, this is likely due to the large aforementioned $3 million dollar sale that boosted that average just prior. With both land and residential the opportunity for a bargain post-pandemic before the real estate market took off was extremely short-lived. There were a few deals to be had during that time, but not many.

2021: Most real estate agents with a close ear to the ground will tell you that they feel the land market has peaked and things have stabilized as of the time of this writing, end of 2021. When looking at the data by quarter, the median sales price was Q1: $145,000, Q2: $150,000, Q3: $175,000 and Q4: $173,500. Obviously still some growth in there (until Q4), but nothing Earth shattering like we’ve been seeing.

Final Takeaway: A final interesting point should include sales prices in 2007 versus today. Interestingly, what they were nearly 15 years ago. In addition, we’ve seen 15 years of inflation and one of the hottest real estate markets in recent history. The bottom line? I believe real estate prices are currently where they should be. Bargain? No. Overvalued and otherwise a bad deal? In my view, no.

Measuring the Value of Land by Price per Acre

November 28, 2021 By Tayson Rockefeller Leave a Comment

I have been meaning to draft this article for quite some time, it is one of those articles that’s relevant in any market. That is, valuing a particular piece of property based on a cost analysis per acre. This is a measure that we will sometimes use when valuing large farm acreages. For us working in the industry, that’s usually where it stops. For others, that methodology trickles down into residential property which in my opinion, is usually not appropriate. I share this opinion with most when discussing values, but usually when customers, be it Buyers or Sellers, start forming their own opinion it’s hard to get them to change their perspective. For Buyers, it’s a way of arguing the value down, and for Sellers the opposite. I’ve heard this a few times…

Anyway. A local analogy I often use as an example is a development between Driggs and Victor. It’s really one large interconnected development with two phases, but it was organized as two separate adjoining developments that share the same rules and regulations. The East half/development comprises 2.5 acre lots and the West half comprises 1 acre lots, but there’s a catch – an important one. The current county density requirement in this area is one home (and guest home if the subdivision allows) per 2.5 acre parcel. The average density of the East development is obviously 2.5 acres. The West development also has an average density of 2.5 acres. Each 1 acre parcel is surrounded by community-owned open space that cannot be developed. Currently on market is a $190,000 1 acre parcel and a 2.5 acre parcel nearby priced at $109,000 per acre. Does that mean that the one acre parcel surrounded by open space is only worth $109,000? Obviously not.

Okay, so the above example is easy to justify. Let’s move across the valley into the Teton View corridor. To keep things fair, we need to keep the area similar. Properties East of State Highway 33 should be valued differently than those West of side of the highway. Let’s compare parcels in developments with no open space, one parcel being 2 acres and another being 5 acres. Am I saying each of these have the same value? No, but they certainly could. What I am saying is that if I were asked to value each of these parcels I wouldn’t even look at the cost per acre (yes, I would look at the overall size) of nearby listings or sales. The important thing to remember here again is that each parcel allows ONE primary home. I could compare 2.5 acre parcels with 5 acre parcels in the primary view corridor all day long and would probably find more 2.5 acre parcels that I would recommend to customers regardless of overall price or price per acre. I’m going to look at budget, proximity from the highway, property features, overall development value and restrictions and of course, the viability of an unobstructed view down the road. In other words, is it conceivable that I would value a 2.5 acre parcel and a 5 acre parcel the same? Absolutely. Does it mean I don’t take the size of a parcel into consideration? No, it does not.

The important thing to understand when determining or justifying the value of any given tract of vacant land is to remember to look at the entire picture. A 2.5 acre parcel overlooking 200 acres of an adjacent development’s open space has tremendous value. Trees, creeks, undulation in terrain, community features and amenities AND size – all of these elements should dictate the value of a parcel. It is not fair or reasonable to value any given property using just one of these metrics.

Updating your Insurance Policies

September 30, 2021 By Tayson Rockefeller Leave a Comment

One of the tools we use to protect our real estate investments includes insurance policies. The obvious one is your homeowners insurance. With both real estate values and construction costs going crazy, we often overlook the level of protection we have in the event of a catastrophe. If you acquired your home more than a year or two ago, it’s definitely time to revisit this.

Even more overlooked includes title insurance. In fact, many of us don’t even realize that we have a title insurance policy. That’s because title insurance policies are issued once, usually at the time you purchased your property. To reiterate a few of my past articles, title insurance is a form of insurance designed to protect lenders and homeowners from financial loss due to a defect in title. Policies are issued to lenders for the loan amount and owners for the purchase amount. Defects in title can range from errors in the public record to liens on the property and a huge variety of other issues related to your home’s title and its history.

So, if you’ve been issued a policy at the time you purchased your property, why update it? Much like your homeowners insurance policy, we have to establish a value to base the policy. If you are insuring your 800k home for only 400k, you’re only covered up to 400k in the event of an incident. Title insurance works the same way. When a title insurance policy is issued, it’s usually for the original purchase amount. If you purchased your property more than a few years ago, chances are that you’ve seen a significant increase in the value of your property. If a defect is found or if one arises, it’s important to remember that you’re only covered for the original amount of your policy. This can be especially concerning for those improving their properties.

When it comes to updating your homeowners insurance policy, it’s usually just a quick phone call to your insurance provider. In most cases they are aware of the market conditions and can easily make adjustments. Increasing insured amounts is not unusual in markets like these, but it will add to the annual premium cost. Updating your title insurance policy can also be done, but it will sometimes require additional information to justify the increase in value. If you are refinancing the property the appraisal is an easy solution. However, even if you aren’t in the process of refinancing, your property’s assessed value with the county can be enough to increase the limits on your title insurance policy. Similar to your homeowners insurance, this will add to the premium, but remember that title insurance is a one-time expense, so the added premium will only be paid one time. In order to update this you will need to contact the title insurance company that wrote the original policy. If you don’t remember who this was, you can usually reference your deed or contact your real estate agent who should have a record of this for you.

Fall ’21 Market Update

September 27, 2021 By Tayson Rockefeller Leave a Comment

The Teton Valley real estate keeps humming along. A few sectors of the market seem to be cooling off, but nothing earth-shattering.

LAND

The second quarter of 2021 seem to be a high point in the market with 190 land sales, consistent with the huge increase in sales since the real estate craze began in 2020. Total volume was just over 42m with sales prices exceeding list prices in many cases, but averaging 91% of the asking price. Of the 190 sales, just over 10% of them were financed.

The third quarter in 2021 brought newfound inventory, likely due to our newfound average sales price for land of just under $220k in 2021 (YTD) compared with an average sales price of just over $121k in 2020, though that average increased significantly as the year came to a close. Total volume was a touch over 38m. While the average sales price is up and sales prices are holding fairly firm at just 4% under the ask, inventory is also up and the number of sales are down over the last quarter. These are indicators that the increase of supply seems to be providing a sense of relief for buyers. We’ve seen a fair share of price reductions, but this is mostly attributed towards overzealous sellers beginning to understand that the current trajectory of land prices likely isn’t sustainable. Of the 138 sales, almost 14% were financed, a bit of an increase compared with last quarter.

RESIDENTIAL

The residential market continues to exceed expectations, likely due to the low inventory of just 58 active listings at the time of this writing and a dismal 14 new construction offerings. The third quarter of 2021 saw 93 residential sales at the time of this writing with home selling on average between 1 and 2% under the ask, with many selling above. The average sales price per square foot was $428 per square foot during this time which included land, this number is fairly consistent with the cost of construction not including land – the biggest factor when considering the lack of new inventory. Teton County reported about 38 new building permits for residential properties which included garage apartments and remodels. Builders have been turning away work with schedules booking several years in advance, but if you canceled projects because of unexpectedly high building costs have created just a few openings with custom home builders.

  • « Previous Page
  • 1
  • …
  • 8
  • 9
  • 10
  • 11
  • 12
  • …
  • 29
  • Next Page »

Recent Testimonials

  • Douglas V.
  • Chuck M.
  • Terry & Joy K.
Teton Valley Realty
Copyright Teton Realty Blog© 2025 - Tayson Rockefeller - [email protected] - 208-709-1333 - sitemap | Privacy Policy, Copyright & Terms of Use